Whenever you’re debugging caching issues, one valuable source of information is the HTTP Cache Headers that are present in the requests. There are multiple ways to see what headers are sent with your requests. We’ll show you two methods of obtaining them.
Method 1: using your browser
Most modern browsers come with developer tools. You can use these to get a plethora of information about the website you’re visiting. One thing you can check is the headers sent and received with your requests. For people who aren’t comfortable using command-line tools, this is the preferred method.
This is how you see them in Chrome:
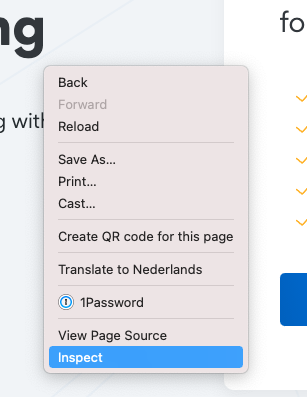
First, we open up the inspector. You can do so by right-clicking anywhere on the page you want to inspect and choosing the last option:
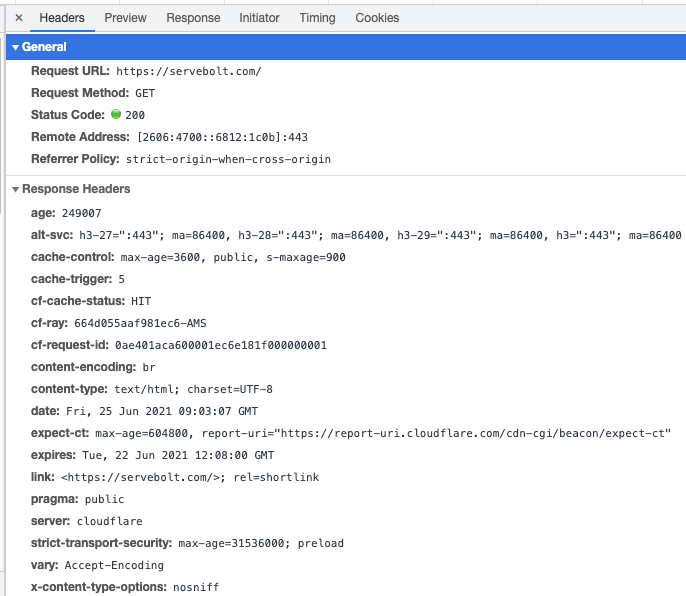
Now, we navigate to the Network tab. Ensure the Disable Cache checkbox is checked, and reload the page. Find the first request made to your page (usually the top one) and click it. You will get more details on this specific request. The information we need is in the Headers tab:
This is how you see them in Firefox:
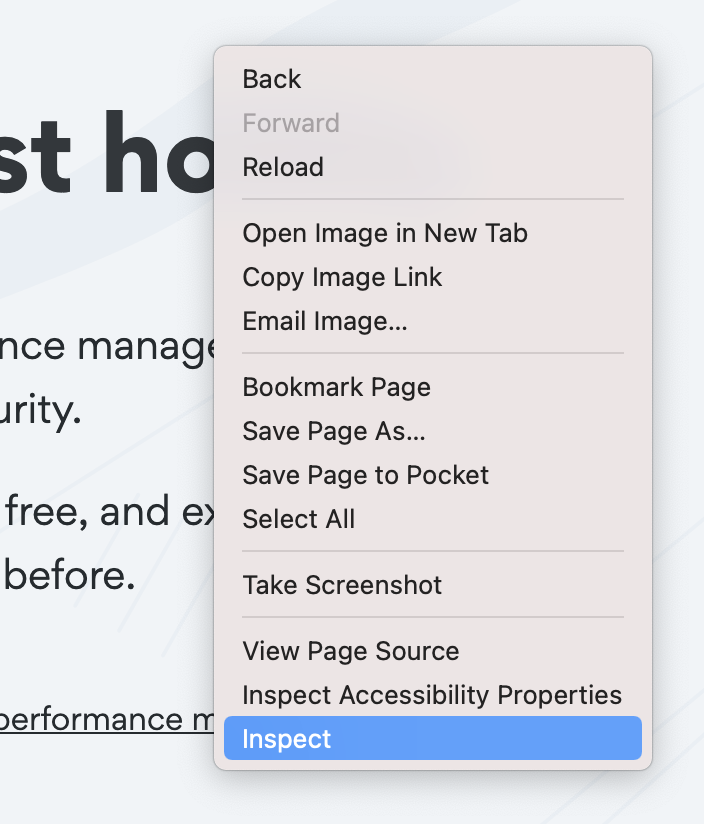
First, we need to open up the Inspector. The quickest way to get there would be by right-clicking anywhere on the page you want to inspect and choosing the appropriate option:
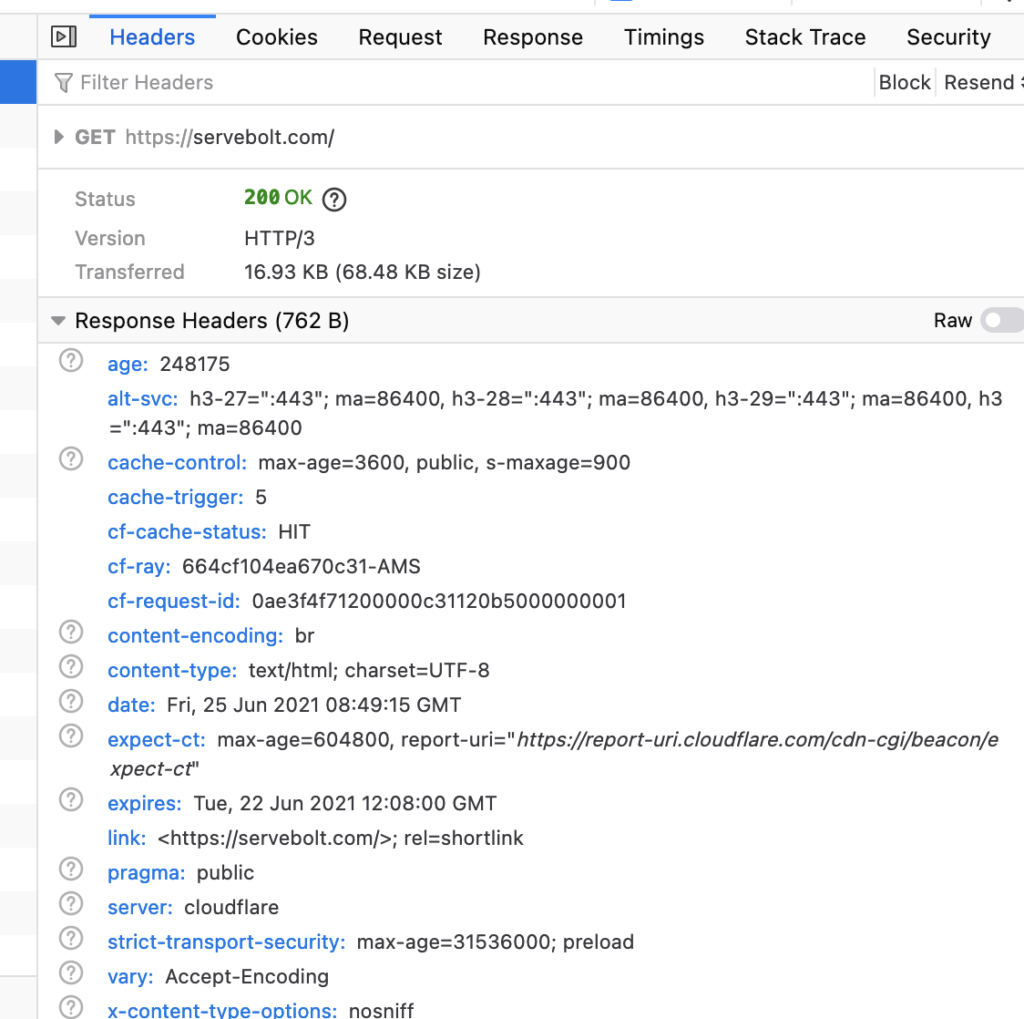
When it’s open, we go to the Network tab, make sure the checkbox for Disable Cache is ticked, and reload the page. You will be presented with a (usually) large list of all HTTP requests made by the browser to render your page. Scroll all the way to the first request made (depends on sorting, but usually on top of the list) and click it. This will give you the needed information:
Method 2: using the command line interface
Most modern operating systems come shipped with a versatile command line tool known as cURL. There are different ways to get the information we need, but for simplicity, we’ll stick to this tool for now. With cURL you can use the -I option to fetch only the headers of the resource you requested:
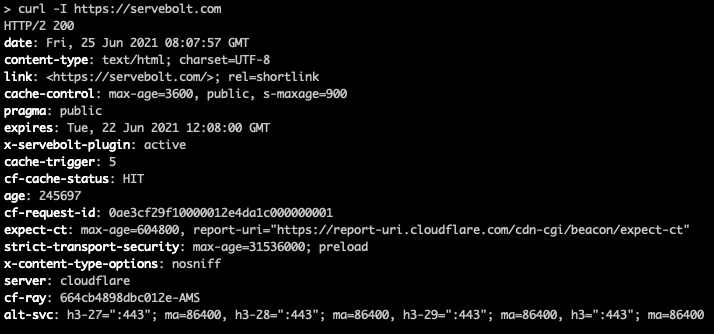
As you can see, this provides you with many more headers than just the caching headers we’re looking for. This is what makes cURL such a powerful tool for debugging various things and not just looking at caching headers.
Checking if the cache is working
Now that we know how to check cache headers, we can use that to see if the cache works for our own HTML cache, Cloudflare and Accelerated Domains.
Servebolt HTML cache
After enabling Static Files + Full-Page Cache in the Admin Panel of your site and enabling the HTML cache in our Servebolt Optimizer, we can use the cache headers to verify whether the HTML cache is working or not.
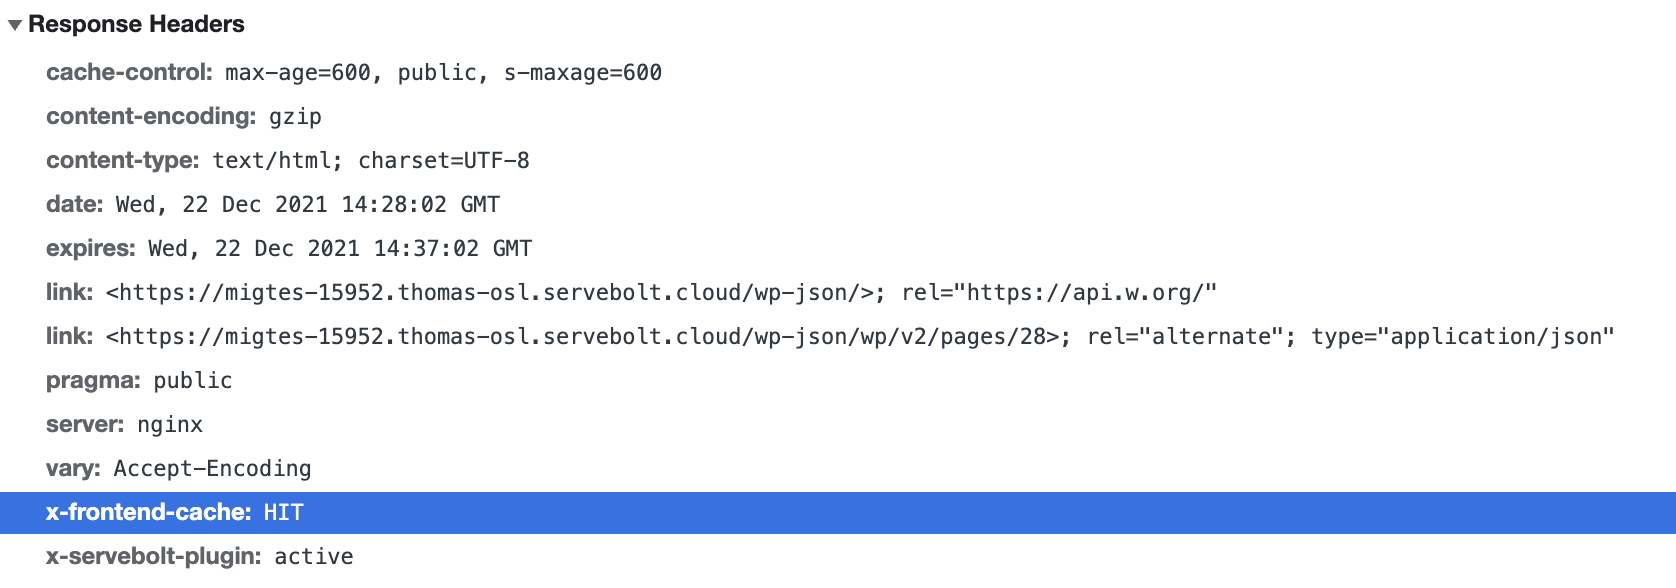
In the highlighted area of cache headers, we can see the following response headers:
x-frontend-cache: HIT. This indicates the frontend cache (HTML cache/Full-Page Cache) is working.
x-frontend-cache: MISS indicates cache is not working on the request being sent.
Cloudflare cache
Cloudflare uses its own headers for cache and applies age: [time-in-seconds] to see how long the cache has lived for.
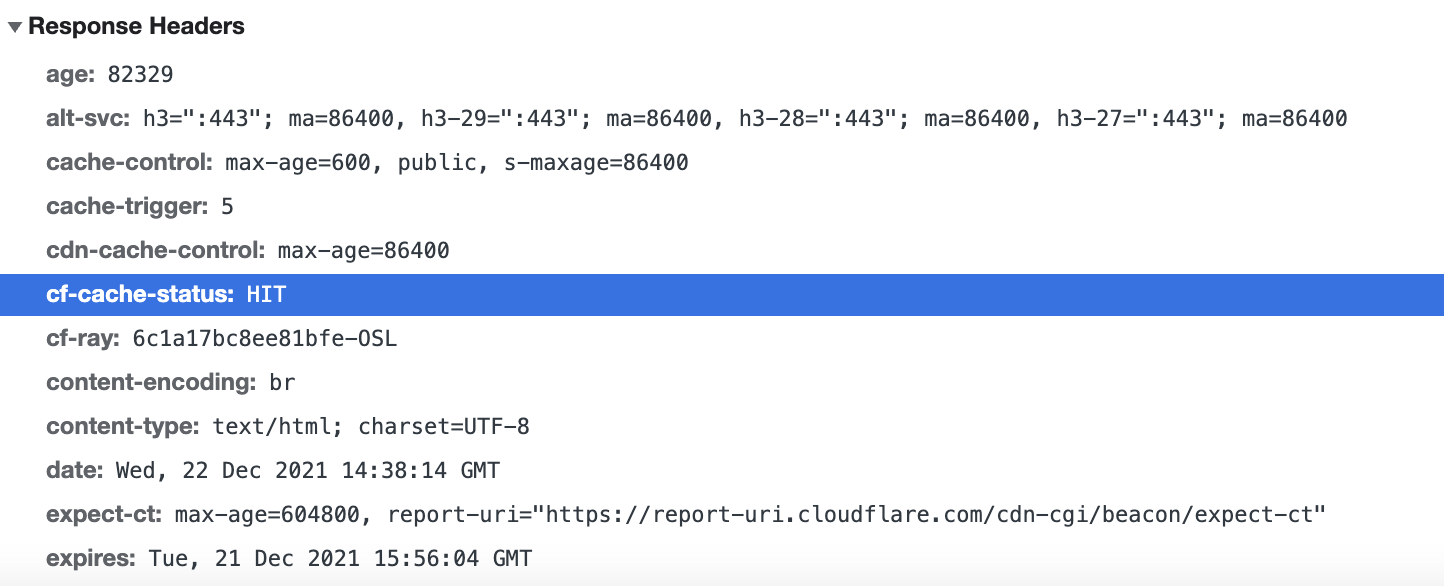
cf-cache-status: HIT indicates that the Cloudflare cache is working.
cf-cache-status: MISS interprets cache is not working on the request being sent.
Accelerated Domains cache
Accelerated Domains cache can be checked in the same way. A working cache would look like this using Accelerated Domains:
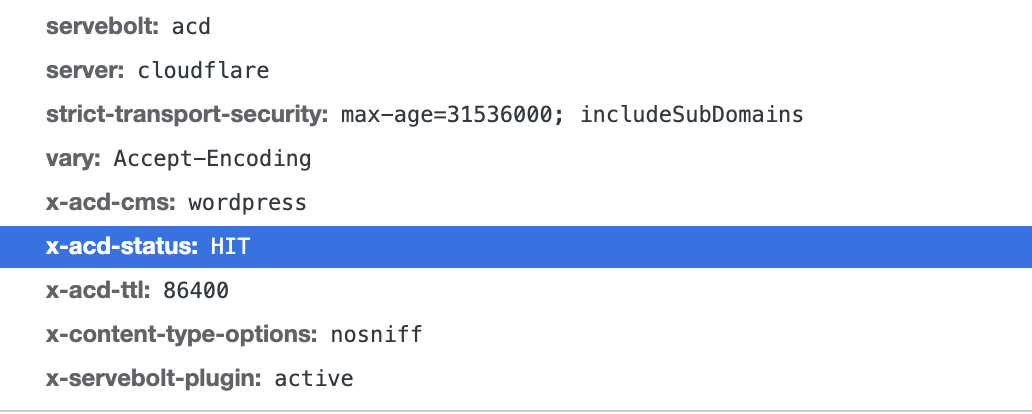
The various cache headers are given by Accelerated Domains:
servebolt: acd indicates that the website loaded is using Accelerated Domains.
x-acd-status: HIT indicates that the cache is working for the request being sent.
x-acd-ttl: 86400 indicates how long the cache will live for the given request. Accelerated Domains cache TTL can be altered using the Servebolt Optimizer plugin.
For more information regarding checking Accelerated Domains cache, please visit this article.
That’s it! Now you know how to retrieve HTTP cache headers and check that the cache is working whenever you need it. Don’t hesitate to contact Servebolt Support if you have any questions about enabling the cache.