A question we get often is how to understand where Dynamic Requests are coming from. To understand this, it’s important to also understand what these Dynamic Requests are and how they are counted. Once we know that, we can start to understand where these Dynamic Requests are coming from.
What are Dynamic Requests?
A Dynamic Request is a request to a non-static resource that was not served by any cache and therefore reaches the origin webserver (Apache). In other words, all requests that are served from a cache, including our own Nginx cache and Cloudflare edge cache, do not count as a Dynamic Request.
All our plans come with a set amount of Dynamic Requests included. The usage of Dynamic Requests is measured by counting the number of requests that reach Apache. Dynamic Requests will also include all requests that cannot be cached in the first place, like POST requests. Typical examples of POST requests are Ajax and API requests. These are mostly generated by your theme or plugins, for example when sending back tracking data to your site or for updating the information in a shopping cart.
How are these Dynamic Requests counted?
Every request that gets sent to your Bolt gets logged in the Access Logs on the server. These logs can then be used to generate an overview of the amount of Dynamic Requests over the logged period.
Every day the Access logs generated by your site are processed on our servers. The requests to static resources are first filtered out and what remains are the Dynamic Requests generated by your Bolt. Add these all up, and we get an overview of the amount of Dynamic Requests generated by your Bolt. The total amount for your current billing cycle can be found in your Dashboard under Plan & Billing.
Why do I want to know how these requests are generated?
When it comes to Dynamic Requests, there are often misunderstandings about the origins and amount of these requests. Understanding how Dynamic Requests are generated is one piece of the puzzle. Understanding how your website works is the next part.
Looking at your visitor’s statistics can give you some insight in the amount of Dynamic Requests that are generated. But you must keep in mind that not every pageview will lead to a Dynamic Request. It might be zero, one or in some cases more than one. This all depends on how your site is built, as some themes or plugins utilise techniques that involve (uncachable) requests going back to your server. Also, your statistics will not always account for all traffic that is visiting your site.
Knowing where your site is generating Dynamic Requests gives you valuable insight: it shows you where potential performance bottlenecks can be found. In most cases, it’s best to serve as many pages from the cache as possible. In some cases that won’t be possible: for example, a visitor who is ordering products, or a site administrator who is updating products or articles in the dashboard. Optimising these requests will improve your site’s performance and therefore improve the conversion rate of your site. (link to Amazon article https://www.fastcompany.com/1825005/how-one-second-could-cost-amazon-16-billion-sales)
How can I analyse these Dynamic Requests?
There are multiple ways of analysing these requests. In the end, it all comes down to the same technique being used: the Access logs of the site need to be processed and the information in them needs to be analysed. Since this information can become technical very quickly, your developer should analyse these logs. There are two methods of analysing these files:
Method 1: command line.
The Access Logs are available through SSH. Using the command line you can manipulate the contents of these log files. The exact commands to use will differ depending on the information that you’re trying to get from the log files.
For example, the following command can be used to get an overview of the top 20 User Agents browsing the site:
zcat ~/logs/AccessLog-* | awk -F\" '{print $6}' | sort | uniq -c | sort -nr | head -20
This will produce an overview looking like this:

If we want to see what kind of pages are getting requested, the following command can be used:
zcat ~/logs/AccessLog-* | grep -ivE "ct:image/|ct:text/plain|ct:text/css|ct:application/javascript|ct:application/rss|ct:application/xml|ct:application/font|ct:video" | awk -F\" '{print $2}' | awk '{print $2}' | sed '/^$/d' | sed 's/\?.*//g' | sort | uniq -c | sort -rn > url_hits.txt
The file named url_hits.txt that is created by this will contain content looking like this:
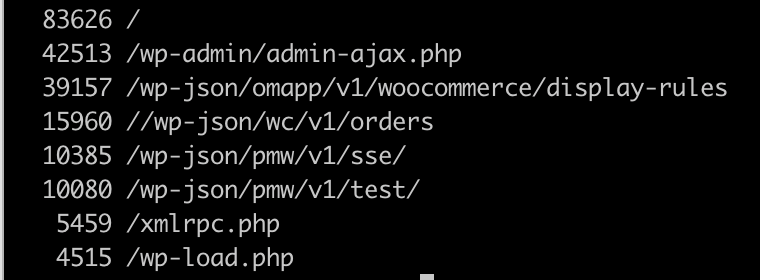
In this example, most Dynamic Requests hit the front page of the site ( / ). The second one is the admin-ajax endpoint of WordPress. Typically this is used by themes and plugins for callbacks to the server using AJAX.
Many other commands can be used as well. It depends on what information you need and your personal preference to see what works best. Just keep in mind that this method doesn’t show direct relationships between requests. As we mentioned earlier, a single pageview can generate multiple requests. These requests are all logged individually without context. The connecting factor is the order in which they get logged. Transforming the data in these logs will make it more understandable, but will also leave out this connection.
Method 2: Statistical analysis tools.
There are multiple methods/tools available that can be used to analyse the log files generated. They differ in functionality, and on how easy they are to use. But in most cases, they will require some setting up to make the best use of it. All these tools are third-party programs, but they can be used to analyse the log files generated by your site. As it comes with third-party tools, our Support team can’t assist you in their usage and inner workings. While there are many tools available, these two examples have good documentation that should help you on your way:
AWStats:
AWStats is a free, full-featured web server log analyzer with support for Apache and the logs it produces. It provides all the statistics and metrics related to user behaviour. AWStats works from the command line as well as a simple web server with very minimal requirements to install and run it.
Elastic Stack (ELK):
The ELK Stack is a widely known set of tools for gathering, parsing and analysing logs from Apache and many other web servers and technologies. The Elastic Stack allows you to aggregate and manage large amounts of Apache logs easily, enrich them, slice and dice through them, and create dashboards tailored to your use case.
Conclusion
Gaining insight into the Dynamic Requests usage of your Bolt is achievable by using different methods. What method suits you best depends on your technical background, experience and tools you prefer using. With the understanding of these requests, you can improve the performance of your site where it matters the most.