Last week the annual WP Hosting Benchmark was published. WP Hosting Benchmark, previously known as Review Signal Performance Benchmark, is the largest, most renowned, and trusted performance benchmark in the WordPress hosting industry.
The benchmark is designed to, through a consistent set of benchmarks and tests, reveal the real performance, scalability, and security of various hosting companies focusing on WordPress.
This year 38 companies participated across 6 WordPress price tiers, and one tier focused on WooCommerce hosting.
The goal of this research is testing the performance of specialized WordPress hosting. The two measures to determine performance are peak performance and consistency. Peak performance is measured using load testing services (LoadStorm and K6) which emulate large numbers of users visiting a website and watching how well the hosting responds under these stressful conditions. Consistency is measured using uptime monitoring to make sure that the servers remain available for a longer duration of time.
Kevin Ohashi, WPHostingBenchmark.com
If a hosting company passes the essential tests, Top Tier status is awarded. This year we’re seeing that successfully completing the tests–and delivering stability and performance–was hard for many participants across all categories. In the price tiers where we participated, there were 24 participating companies.
Of those, there were only 8 companies that exclusively got Top Tier statuses in the categories they participated in. 13 companies if we include honorable mentions.
TL;DR
Servebolt was awarded Top Tier in every tier we participated in, just like the previous two years. To get Top Tier status across all products in many price categories in itself is a solid achievement.
Independent of which product our customers choose, you will receive the same care, stability, and fundamental performance. We provide professional operations that ensure availability over the lifetime of any website.
Servebolt competed in the most tiers of all companies in the benchmark and received the top tier in all tiers.
| Price Tier | $51-$100 | $101-$200 | $201-$500 | Enterprise | Woo | # tests | 100%⭐️ |
|---|---|---|---|---|---|---|---|
| Servebolt | ⭐️ Top Tier | ⭐️ Top Tier | ⭐️ Top Tier | ⭐️ Top Tier | ⭐️ Top Tier | 5 | ⭐️ |
| Servebolt Accelerated | ⭐️ Top Tier | ⭐️ Top Tier | 2 | ⭐️ | |||
| Scaleforce powered by Jelastic | ⭐️ Top Tier | ⭐️ Top Tier | ⭐️ Top Tier | ⭐️ Top Tier | 4 | ⭐️ | |
| RAIDBOXES | Honorable mention | ⭐️ Top Tier | 3 | 🚫 | |||
| Seravo | ⭐️ Top Tier | 🚫 Failed | 3 | 🚫 | |||
| WordPress VIP | ⭐️ Top Tier | 1 | ⭐️ | ||||
| CloudJiffy powered by Jelastic | 🚫 Failed | 🚫 Failed | 🚫 Failed | 🚫 Failed | 5 | 🚫 | |
| Infomaniak powered by Jelastic | 🚫 Failed | 🚫 Failed | 🚫 Failed | 🚫 Failed | 5 | 🚫 | |
| Presslabs | 🚫 Failed | 🚫 Failed | 🚫 Failed | 3 | 🚫 | ||
| WPOven | 🚫 Failed | 1 | 🚫 | ||||
| Pressable | ⭐️ Top Tier | ⭐️ Top Tier | ⭐️ Top Tier | 4 | ⭐️ | ||
| Cloudways | 🚫 Failed | ⭐️ Top Tier | 2 | 🚫 | |||
| Lightning Base | ⭐️ Top Tier | ⭐️ Top Tier | 3 | ⭐️ | |||
| SaveInCloud powered by Jelastic | 🚫 Failed | 🚫 Failed | 2 | 🚫 | |||
| SiteGround | Honorable mention | ⭐️ Top Tier | 4 | 🚫 | |||
| A2Hosting | 🚫 Failed | 🚫 Failed | 3 | 🚫 | |||
| WPX | ⭐️ Top Tier | 3 | ⭐️ | ||||
| WordPress.com | ⭐️ Top Tier | 2 | ⭐️ | ||||
| IONOS | 🚫 Failed | 3 | 🚫 | ||||
| ICDSoft | 🚫 Failed | 2 | 🚫 | ||||
| MDDHosting | 🚫 Failed | 2 | 🚫 | ||||
| Nexcess | Honorable mention | 🚫 Failed | 3 | 🚫 | |||
| GreenGeeks | Honorable mention | 2 | 🚫 | ||||
| ManagedWPHosting | 🚫 Failed | 2 | 🚫 | ||||
| GoDaddy | 🚫 Failed | 1 | 🚫 | ||||
| EasyWP by Namecheap | 1 | ⭐️ | |||||
| Rocket.net | 1 | ⭐️ | |||||
| Eco Web Hosting | 1 | ⭐️ | |||||
| 20i | 1 | ⭐️ | |||||
| CynderHost | 1 | ⭐️ | |||||
| Bluehost | 1 | 🚫 | |||||
| Krystal Hosting | 2 | 🚫 | |||||
| 34SP.com | 1 | 🚫 | |||||
| AleForge | 1 | 🚫 | |||||
| ChemiCloud | 1 | 🚫 | |||||
| GoDaddy | 1 | 🚫 | |||||
| InMotion Hosting | 1 | 🚫 | |||||
| RSHosting.com | 1 | 🚫 | |||||
| TVC.Net | 1 | 🚫 |
To give you an idea of how much better Servebolt’s PHP Bench score is, let’s look at the average score across all tiers with Servebolt excluded. This average was 7.7 seconds and 7.2 seconds in the tiers Servebolt participated in. With our results being less than 4 seconds, it’s clear our relentless focus on optimizing PHP is paying off.
“Servebolt is the only company who has broken sub 4 seconds on PHP Bench.”
WP Hosting Benchmarks – Kevin Ohashi
Our PHP Bench clocked in at 3.245 seconds. Servebolt also did extremely well on the WP Bench test. We deliver an average WP Bench result of 1787 queries per second. Compared with the average across all tiers, 975 queries per second, it is clear that Servebolt hosting is once again blowing away the competition.
What products did we participate in?
WP Hosting Benchmark lets us define in which price brackets we like to participate. This year, we’ve entered with the following products:
| Price bracket | Product | Top Tier |
| $51 – 100 | Servebolt Pro Plan + Cloudflare Free | ⭐️ |
| $101 – $200 | Servebolt Pro Plan + Cloudflare Pro | ⭐️ |
| $201 – $500 | Servebolt Pro Plan + Cloudflare Business | ⭐️ |
| $201 – $500 | Servebolt Pro Plan + Accelerated Domains (called Servebolt Accelerated in the test) | ⭐️ |
| $201 – $500 | Servebolt Pro Plan + Cloudflare Business | ⭐️ |
| $201 – $500 | Servebolt Pro Plan + Accelerated Domains (called Servebolt Accelerated in the test) | ⭐️ |
| $201 – $500 | Enterprise Servebolt Business Extra Plan + Cloudflare Business | ⭐️ |
| $500+ | Enterprise Servebolt Business Extra Plan + Accelerated Domains (called Servebolt Accelerated in the test) | ⭐️ |
| $100 | WooCommerce Servebolt Pro Plan + Cloudflare Free | ⭐️ |
Our summary of the results
New this year
The hosting benchmark tests included two new tests this year. The internet.nl is a test that checks how modern the technical setup is, including IPv6, DNSSEC, HTTPS, and Security options (like security headers).
The internet.nl Test
A large number of companies had very low scores on this one. Our newest product Accelerated Domains scored 2 x 95 out of 100. Our customers can be certain that we are investing in future tech and that the hosting services they get from Servebolt are at current technological standards and way beyond most of the other hosting companies.
The average in the internet.nl test (without our own results) is 41, the average including us is 44, and our average is 76. That means that Servebolt has an 85% higher score on this metric compared to the average, with our newly launched product, Accelerated Domains, leading the pack, missing only the last 5 few points to max out the scale.
The Mozilla Observatory Test
The concept of HTTP Security Headers has been gaining solid traction in the last year, and we have some internal processes going on in Servebolt with regard to how we are going to do the implementation for our customers. We have already implemented a few of the safe security headers features in our stack and Accelerated Domains, but there’s a lot more that can be done.
The challenge in this test is that a lot of security headers are unsafe to set automatically. Only the Enterprise category allows for custom optimizations and changes to the installation, and since this test was new – it looks like most companies did not implement it this year. We’re sure that will be changing next year, though!
Out of 85 total tests, 59 got the worst result F (that’s about 69% that did definitely not pass). The top result of a Top Tier awarded plan was EasyWP by Namecheap in the entry-level category; they achieved a B. Good work, Namecheap! Our own results ranged from D- to C-, which made us stand out in most categories, even “winning” a few.
LoadStorm
The LoadStorm test is designed to test the response time in combination with scalability when delivering HTML. This test is designed to mimic something similar to the actual user load, with a combination of requests that can be cached and requests that cannot be cached.
For most WordPress sites, you don’t want a hosting company that can only be performant when there is a cache in place and when the content delivered can be cached. You want a hosting company that is performant, always.
The following graph is a graph with a lot of information, so it might not be super obvious what to focus on. For the WordPress tests represented in the screenshot below, we see wp-login.php Average Response Time and Average Response Time as the most important metrics to look at.
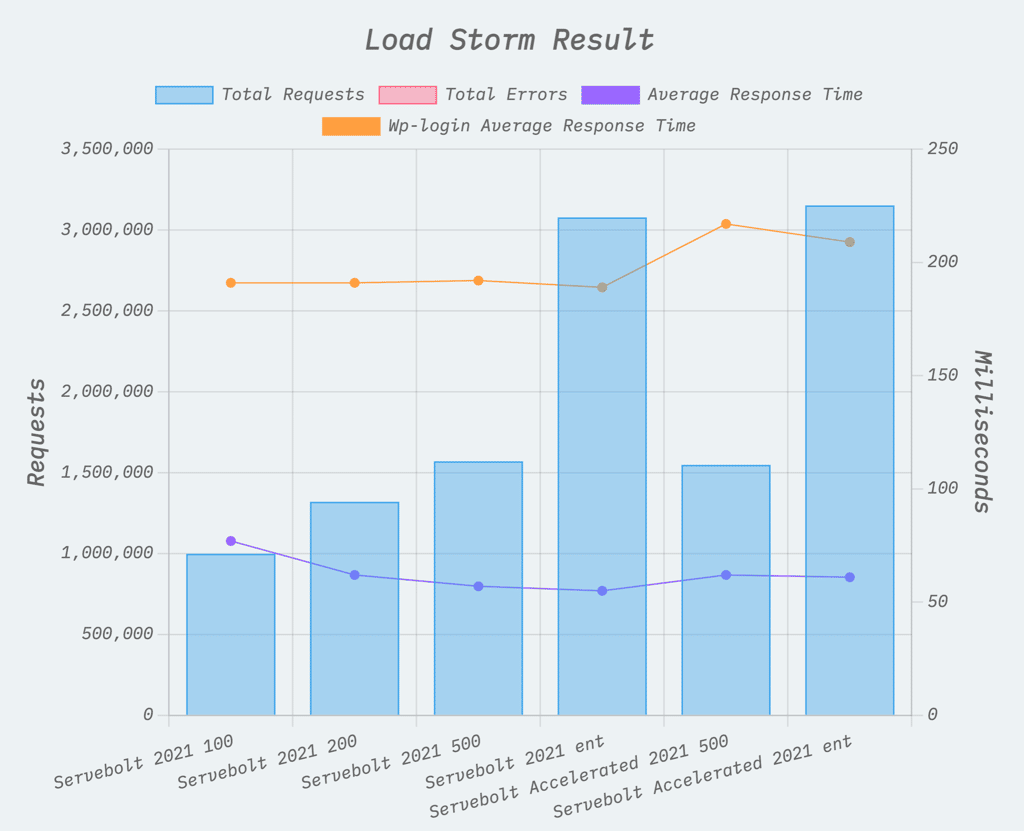
wp-login.php Average Response Time
If you want to know how a server performs under (heavy) load, you need to test for actual server performance and not how well that server caches. In most hosting environments, the wp-login.php page cannot be cached. This means the wp-login.php page is a safe and good page to test how well a server performs under a load.
On the wp-login.php average response time metric, you want an as low result as possible. For the wp-login.php test, Servebolt had an average score of 198ms. All of the Servebolt plans that got tested scored in the top 10 of all the plans combined for all hosting companies. The average across all tiers–all hosting plans from all hosts–was 888ms, and the average in the tiers Servebolt participated in was 573ms.
This means Servebolt significantly performed better in absolute and relative terms. Our servers are optimized for raw performance and scale while doing so. The wp-login.php test demonstrates just that.
Average response time
The average response time is important as this shows–you’ve guessed it–the average response time across all the requests made. This includes both cached and uncached requests and says something about the overall performance.
For this metric, Servebolt scored with several positions in the top 10! Across all tiers and all plans tested from all web hosts, we take first, second, third, fourth, fifth, and eighth place. Our average result across all tiers was 62ms. The average for the rest across all tiers was 488ms, with an average in the tiers we participated in at 254ms. Again a perfect example of how Servebolt offers better hosting than any of the other hosting companies.
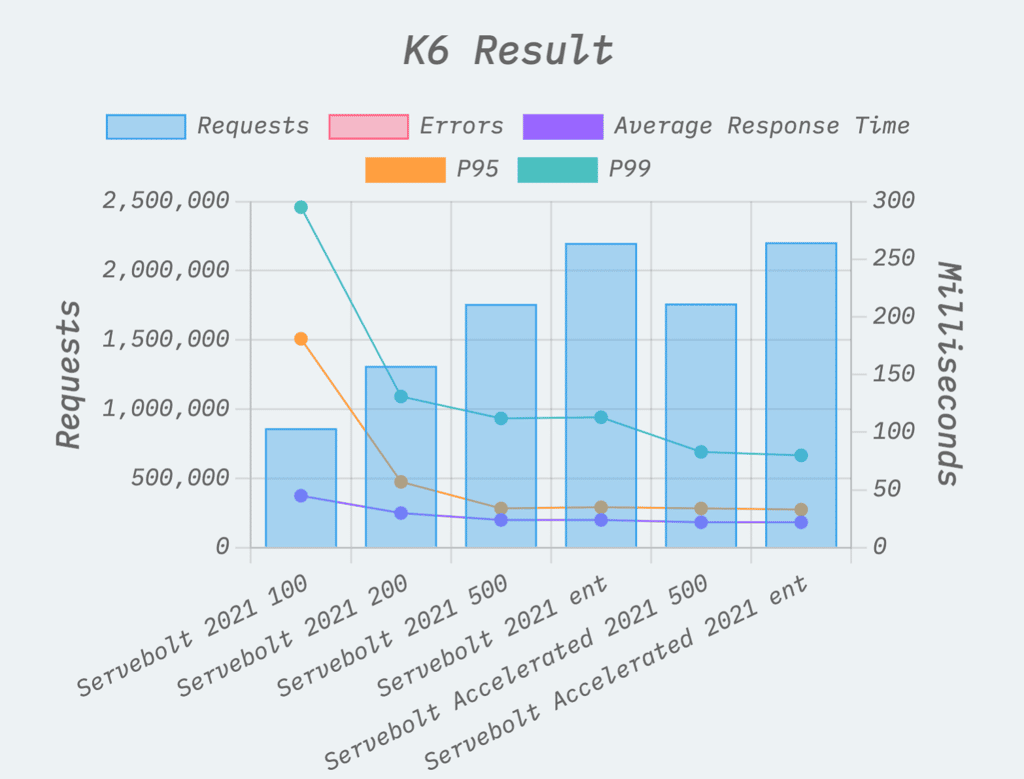
K6
K6 is the cache test. It’s hammering a single page throughout the entire test. If the test is run directly against a web server, the host may run into bandwidth issues or CPU exhaustion. Many hosting stacks, for example, compress data on-the-fly, even though a page is cached, which means CPU is required for every request. Most companies (like ours) use a CDN on top of their services. We use Cloudflare Plans (of different sorts) and Accelerated Domains. When using a CDN, the K6 test is largely a test of whether or not the CDN is correctly configured, and the response time will differ relative to the network K6 is testing from.
The emphasis in this test should be on having a low error rate and a stable response time throughout the test. Any Average Response Time results that are lower than 100ms will deliver a flawless user experience. We’re ranging from 45ms on our entry-level plan down to 22ms on average in the Enterprise category
It’s also notable that we have 0 and 1 errors in the Enterprise category, 1 and 2 errors in the $500 category, 0 in the $100-$199 category, and 1 in the $51-99 category. This is on a request number ranging from 800 000 requests to 2.3 million requests.
WebPageTest
WebPageTest (WPT) is an online tool that allows you to test page views from many different locations worldwide. In this test, 13 locations spread across the globe were used along with the result for every location, and an average global load time was calculated.
Looking at the average response times globally, Servebolt takes 5 slots on the top 10, including the fastest average response time across all tiers. Our average response across all the tiers we participated in was 0.79 seconds, with the fastest response at 0.46 seconds.
The average response across all tiers and participants was 1.34 seconds, and if you exclude Servebolts results, the average is 1.38 seconds.
In the Enterprise test, we came in second and third place with our two products, only beaten with 3ms and 5ms. However, it is worth noting that Seravo failed to load the favicon (the icon in the browser bar), which doesn’t disqualify them but definitely gives them significant savings on the end result. Instead of loading the 3.5Kb image, they returned a 404. In doing so saved a request and everything that comes with it.
Had they loaded the site in the shape it was supposed to be, with the favicon, they would have ended up in third place. Pushing our Enterprise Accelerated Domains and Servebolt Enterprise to the top of the result list. It’s not possible to get that additional element delivered on average in less than 5ms.
Servebolt Accelerated
When the performance benchmarks started up, we already had a prototype of our yet-to-be-released product, Accelerated Domains running. In this year’s test, it’s the prototype that got tested, the product itself launched in April, and a long list of security and performance features have entered the product already, compared to the tested product.
In terms of results, the product performed generally on par with our traditional offerings in the $201-$500 and Enterprise categories (which is amazing, of course), although it is an entirely different and new product.
Accelerated Domains is the future of hosting, available today. This is especially visible in the internet.nl test – which was new this year – that tests how modern the delivery stack is and what security measures it relies on. Getting 95/100 points here emphasizes the importance of being able to implement new technologies as services to end customers quickly and easily.
WP Hosting Benchmark Analysis of Servebolt’s Participation
We invite you to read the WP Hosting Benchmarks analysis yourself, for instance, this one for the 50 – 100 bracket, but we’ve highlighted the following quotes from the article for your convenience.
$51 – $100
Servebolt had 100% uptime on both monitors. It easily handled the load tests including the second fastest K6 average response time (tie) and the fastest average response time and WP-login response time on Load Storm. It had the fastest PHP bench and second fastest WP bench. It had the second best WPT average response time. Servebolt definitely earned Top Tier status again.
Kevin Ohashi, WPHostingBenchmark.com
$101 – $200
Servebolt earns a Top Tier mark again this year. 99.99% uptime. The fastest average response time on Load Storm (and second fastest wp-login.php). K6 was smooth. Servebolt had the best scores compared to others in this tier on the WPT test in all 12 locations and the fastest PHP and WP Bench scores. Overall, a very impressive showing at this tier.
Kevin Ohashi, WPHostingBenchmark.com
$201 – $500
Servebolt earned Top Tier marks again. This plan had the fastest Load Storm average response times and wp-login response times. Throw in perfect uptime and the second fastest WPT, PHP and WP bench scores (only slightly edged by the Accelerated product), it was easily a Top Tier performance.
Kevin Ohashi, WPHostingBenchmark.com
$201 – $500 + Accelerated Domains
Servebolt Accelerated easily earned Top Tier status this year. It had the second fastest Load Storm average response time and wp-login response time. It handled the K6 test with ease. It maintained uptime above 99.9%. The only issue that caused any downtime was a DNS entry mistake since it was using a subdomain on the primary domain. It also had the fastest WPT average response globally and the fastest WP and PHP bench scores.
Kevin Ohashi, WPHostingBenchmark.com
Enterprise
Servebolt continues to stand out even amongst the best of the best and earned another Top Tier award. Perfect uptime. The fastest Load Storm response times generally and for wp-login.php. Fast and errorless K6 test. The fastest PHP Bench and second fastest WP Bench. Third fastest WPT average in a very narrow race for first. An easy Top Tier award.
Kevin Ohashi, WPHostingBenchmark.com
Enterprise + Accelerated Domains
Servebolt Accelerated earned Top Tier recognition for an impressive performance. The second fastest Load Storm average and wp-login.php response times. The second fastest WPT average. The fastest WP bench. The second fastest PHP bench. There’s just a lot of first and seconds and it’s because it was a Top Tier performance.
Kevin Ohashi, WPHostingBenchmark.com
$100 WooCommerce
Servebolt earned another Top Tier award this year. 99.999% Uptime. The fastest Load Storm average response time. Also the fastest wp-login.php, Buyer and Customer profiles and second fastest Home profile. A solid K6 test. The second fastest WPT results. The fastest PHP Bench. Clearly a Top Tier performance well earned.
Kevin Ohashi, WPHostingBenchmark.com
In Conclusion
All in all, we are extremely pleased and proud of this year’s result. The list of companies that achieved Top Tier status across all the price tiers they participated in is very short. We had the highest number of tiers and plans being tested, which also means we had the most opportunities to fail.
In addition, we ranked very high and topped a few of the new tests, which emphasizes our focus on new, modern, and optimized technology and rapid adoption thereof.
We, therefore, think this year’s performance, getting only Top Tier awards, reflects the quality of our services and operations and that we’re delivering security, scalability, performance, and quality of service that is usually only available to Enterprise customers.
Curious to see what Servebolt can do for your website? We offer free trials for up to 60 days and free migrations so you can fully test our performance. Just create a Servebolt account here and request migration for your free trial site here.