Have you ever had the feeling that your website is not as fast as the website speed test tells you it is? And do you wonder why? Well, that is because testing website speed for performance takes more than just a regular online test.
At Servebolt, we have regular discussions with website owners and developers about performance and testing website speed. To our surprise, the majority of webmasters test their websites for performance incorrectly.
In this article, we are lining up a few testing methods that may help you on the path to making websites with super snappy response times.
Let’s just say it out loud before we start this:
You think your website is fast because you are testing your cache.
If you want an unbiased view of your website’s response time, check out the Search Console’s Crawl Stats report. Google doesn’t lie.
Table of contents
You Need More than Conventional Site Speed Tests
When it comes to web performance, it is important to pay attention to how it feels. After all, web performance is all about perception. Especially when something feels slow, it always is because it actually is slow.
If you are serious about testing your or your client’s website for performance, then the conventional methods are not enough to test website speed. To help you understand this better, go through the reasons I listed below.
Repetitive Tests Produce False Results
The most common reason is that the tests you run do not provide results that are equivalent to a normal, random visit to your website. What people tend to do, is to run a test in Pingdom Tools and then re-run it a couple of times until it produces the loading speed numbers that are acceptable. But doing this is tricking only the test and does not translate into the experience your website visitors get.
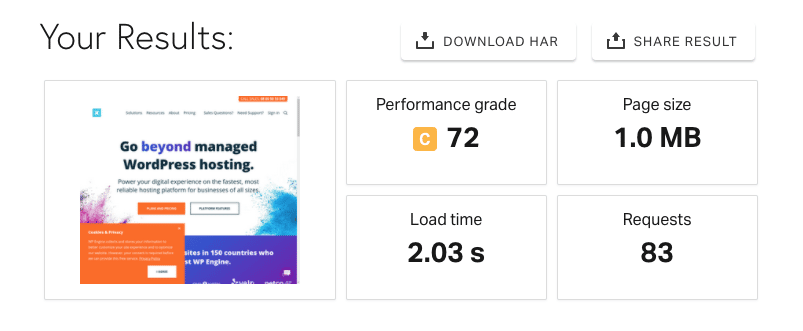
For example, re-running the site speed test for WP Engine using Pingdom produced different results.
First Test:
Second Test:

Third Test:
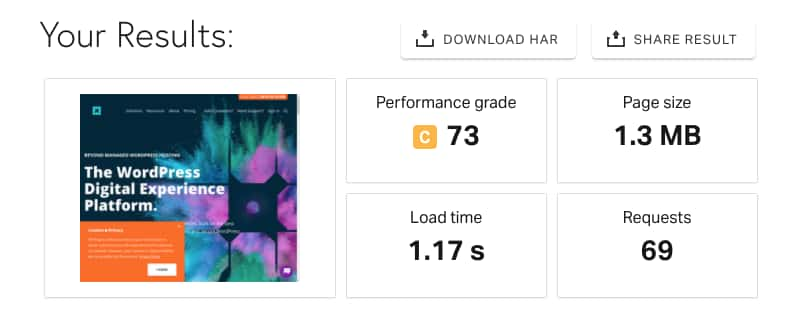
In the first test, the load time was 2 seconds, while the requests were 83. In the second test and third tests, load time was reduced, as well as the number of requests. Visitors to your website do not reload the page when they land on a page on your website, they move on, read, and hit the next link they find. To make a website truly performant, you will have to deliver fast results on this very first visit.
So why different results when I kept everything the same? I will answer this in the next section, along with another example.
Use Chrome DevTools for Testing Website Speed
Chrome comes with a built-in tool known as DevTools that allows you to run various tests and monitor progress in real-time. However, tools like Pingdom and Google PageSpeed Insight can also show similar stats. DevTools runs on your computer and gives much more personalized stats that are closer to real user experience.
The Myth Behind Caching
Caching does not guarantee true performance and is definitely not the ultimate solution for website performance. It might make your website look great on the Pingdom test, for that matter (as seen above in the WP Engine test), but in reality, the cache does not help if the visitor is visiting the site for the first time.
There are two absolute truths about caching that you need to know about. First, caches need to be filled before they can be used. When the visitor enters a site for the first time that uses a full-page cache, several requests are made to the server to fetch the required assets and information to display on the webpage. That means that caching is a performance enhancement and will never work for the first request.
The second important thing is that caches always expire. This means that even though you cache a page now, the cached page will at some point be erased from the cache – and the cached element needs to be rebuilt.
Caching as a performance enhancement is widely recommended by close to all hosting companies. The reason for this is that full-page caching always will have a positive impact on resource reduction on the server level. However, this does not automatically mean that full-page caching will give your website overall better performance.
In our article about How Caching Works in WordPress we spoke about the origins of caching on the web and under what circumstances caching can be effective. Full-page caching can be effective for scaling if you have largely static web pages. Otherwise, your users will keep looking at the outdated information that was cached for them already. In reality, that is not how the average normal WordPress, WooCommerce, or Magento websites are built.
How caching works live in action is that full-page caches only provide performance improvements for recently accessed pages (good for scalability, but with limited effect on performance). So how to test website speed by bypassing the cache?
Bypass Cache while Running Site Speed Test
As discussed previously, the cache is not helpful for the initial visit, and it is important to test website speed without the cache to know the true performance standing of your website. There are two ways of bypassing the cache.
- Use cache buster parameter: Cache Buster is a parameter that you can add to your base URL to bypass the cache to simulate a new visitor experience.
- Bypass cache using Chrome DevTools: You can also bypass cache using Chrome DevTools. The option is present inside the Network section.
Testing the Real Performance of a Cached-based Site [Case Study]
WP Engine primarily bases its hosting speed and performance on caching. Their own website is a perfect example of how caching does not work very well for websites.
We tested their site with Pingdom Tools. The first test of their front page in 1.5 seconds. That is a result that is acceptable within the recommended thresholds outlined by Google PageSpeed Insights and other similar recommendations.

But let’s test how fast their underlying performance really is. We can simply add a cache buster to their URL, so we make the next request to the following URL:
https://wpengine.com/?cache=busted3

This time the website took 2.19 seconds to load, which is somewhat close to what we had the first time we ran the Pingdom test at the beginning of this article to demonstrate variation in results when repeating the site speed test.
How to Test Website Speed Correctly?
While testing a website for performance, it is important to consider worst-case scenarios. What that means is, to optimize the most basic elements and then work your way up to more advanced speed optimization enhancements like caching.
So where to begin? Start by identifying the performance parameters that can directly affect the user experience of your website.
Parameters That Can Affect Performance
Slow Networks
Slow networks can have a huge impact on your site performance. This mainly applies to mobile users who can be connected to 3G or 4G networks. You can test the performance of your website for slow networks using Google’s Speed Score Card tool.
Latency Issues
Latency is another issue that can cause a bad user experience for your visitors. It occurs due to the physical distance between the server and the visitor. It is best to run website speed tests from locations that are far away from your server and especially those that you are targeting as a business.
Cache-less State
As discussed previously, a cache is prone to produce false performance scores that can lead to a bad user experience. Bypassing cache while testing can truly reveal the underlying performance issues.
Core Web Vitals
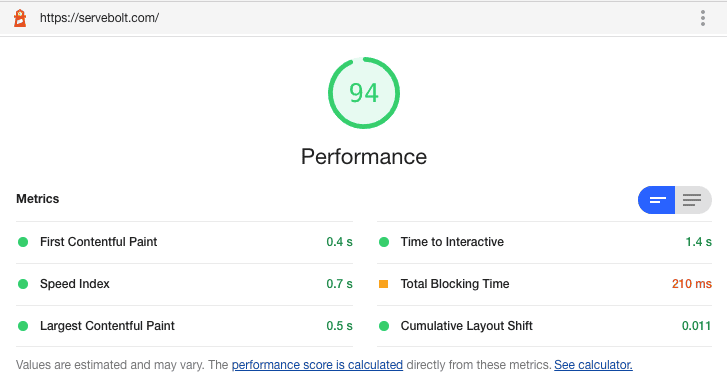
Core Web Vitals measure the actual user experience from the field data that is gathered from Chrome browser data. The Largest Contentful Paint (LCP) in the Core Web Vitals determines how long it takes for the largest element on your site to load. The ideal LCP time is 2.5 seconds or faster.
Other Core Web Vitals, such as First Input Delay (FID) and Cumulative Layout Shift (CLS) also based on the performance of your website. They are not linked with the initial load time, but they do affect the performance of your website, hence, the user experience.
To check Core Web Vitals, head over to Chrome DevTools → Lighthouse and check Performance from the options.
Time to First Byte (TTFB)
The average response time of the first request on any random page load on your site is the single most important thing to pay attention to. If the response time of the first request is slow, your site will never feel fast, no matter how much you optimize the rest of your webpage.
The reasoning for a quick first response time is very simple. Your site has to respond within the blink of an eye, or else the delay will be noticeable to the visitor. In practice, that means you have about 400ms to make the page and get it delivered to the end user (including network latency).
For websites basing their performance on caching, the load time distribution of a website often looks similar to this:
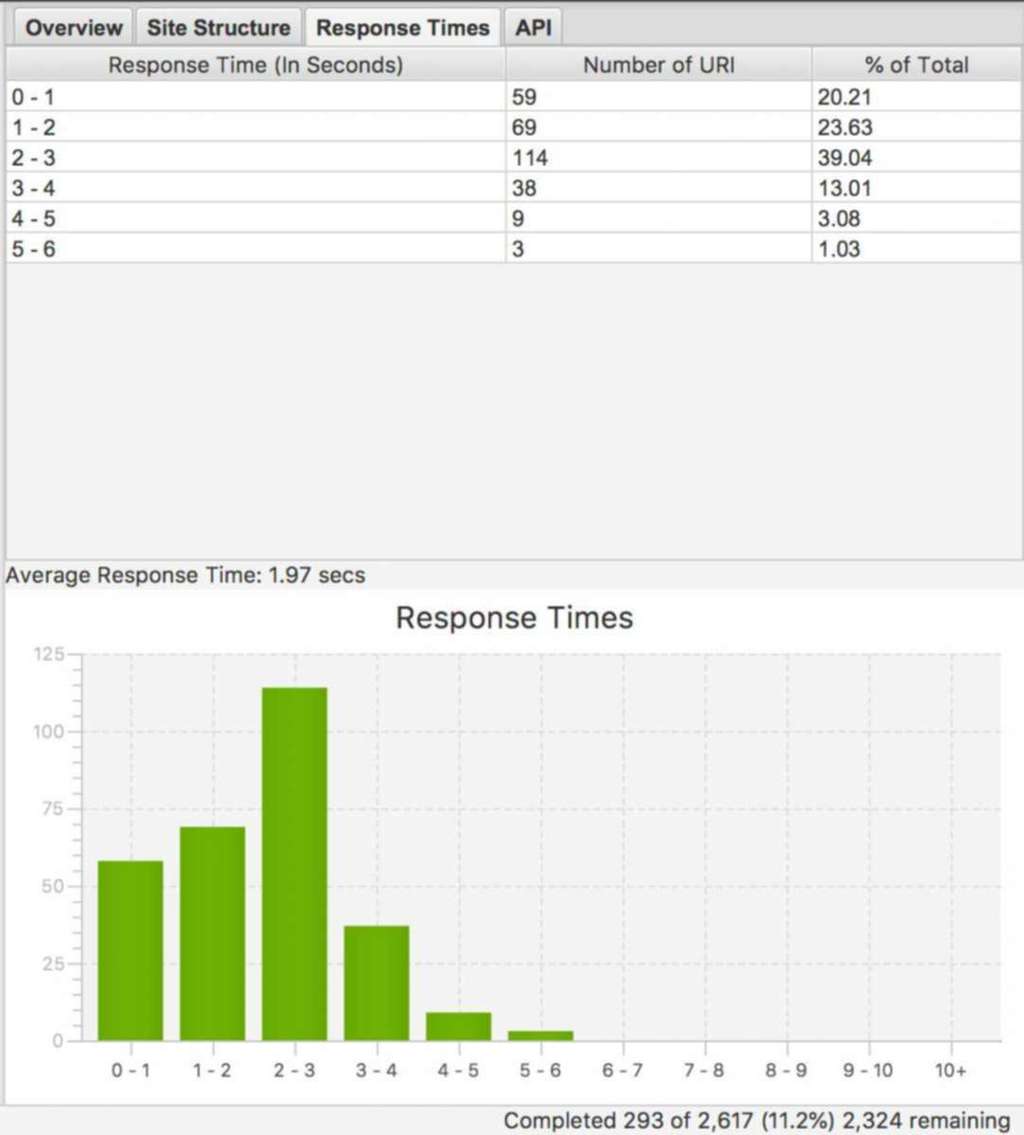
A small subset of the pages respond in the 0-1 second range (typically cached), while the majority of pages respond in 2-3 seconds, and the average overall page response is approximately 2 seconds. When your response time distribution looks like this, your website is having performance issues – and you need to get your hands dirty to improve the performance on all pages. Caching won’t save your day.
Note: The above graph only represents a specific case. Even some slow sites can have 90% of their pages under a 0 – 1 scale. Therefore, running a thorough audit is important.
What people think they get with caching but don’t – are the following numbers. These are from a highly dynamic high-traffic E-commerce website that runs completely without full page caching and where absolutely all requests to the website respond in under 0.5 seconds.
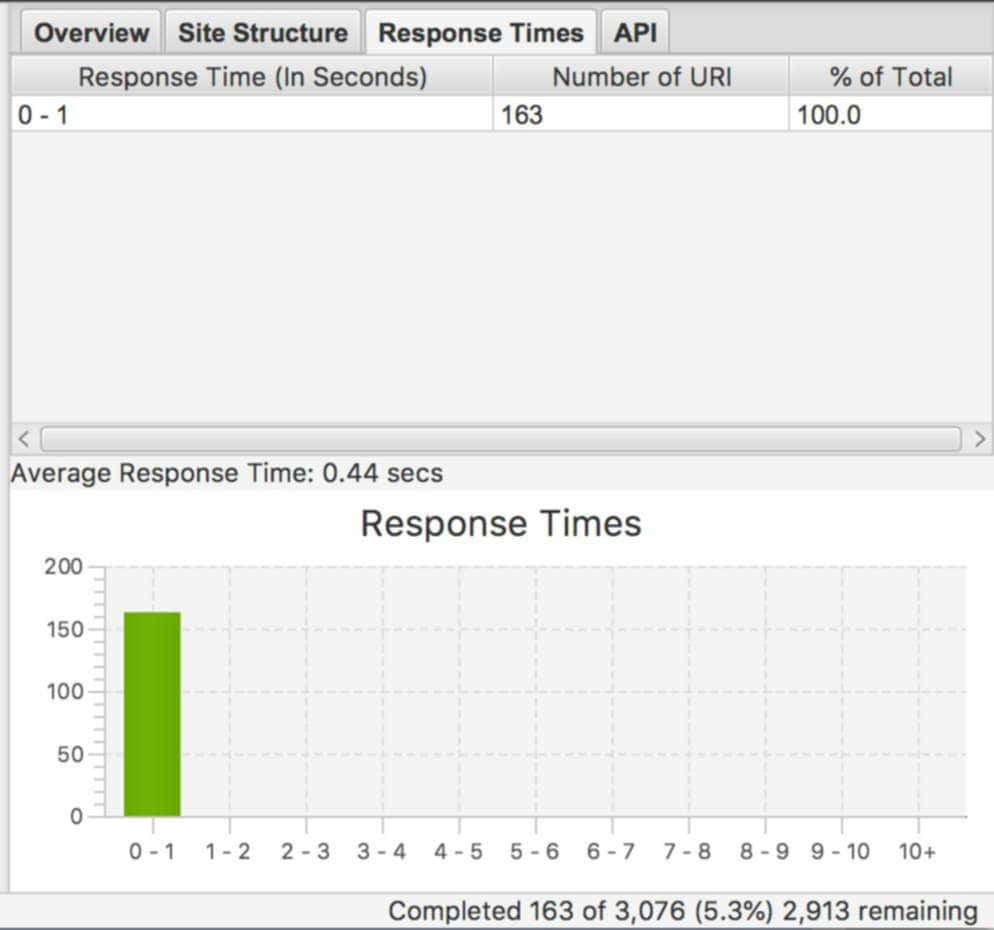
To relate this to the WP Engine website’s loading times, this graph delivers 100% of page views in ~0.4 seconds, whereas WP Engine does this only for about 15% of pages on their own website.
Consider Visitors Entering The Site from Random Pages
The first thing to be aware of is that users do not just enter your website through your front page. If you check out the landing page view in Google Analytics you will probably find that you have visitors that land on close to every page on your website. The front page usually has a larger share than many other pages, but even if 30% land on your front page – there are still 70% of visitors landing on other pages.
Consider Visitors Entering The Site From Different Regions
We often run site speed tests from the same location, which is not a good practice. Visitors from around the world can land on any page of your site. The simplest way to check the performance of your website for different countries is to use the Site Speed feature of Google Analytics.
Google Analytics → Behaviour → Site Speed. Scroll down for the country report.
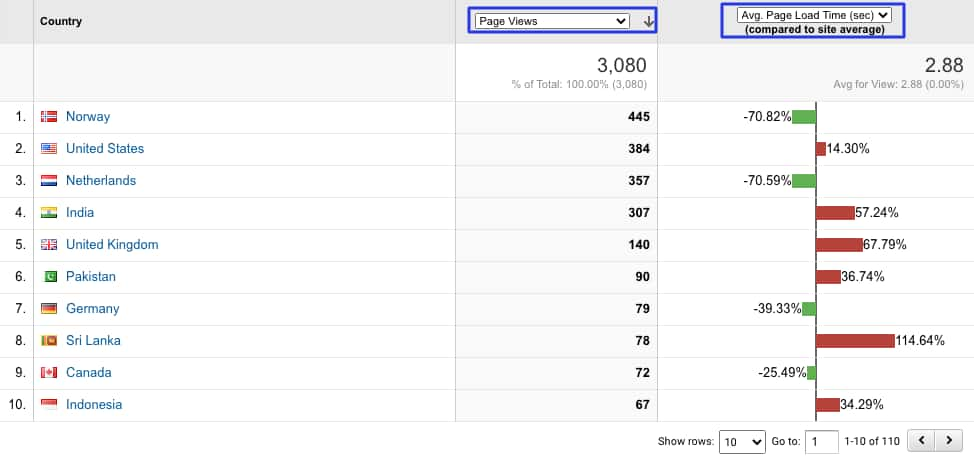
As per the above graph, the average response time is 2.88 seconds. For countries like Norway, Netherlands, and Germany it is under the average, while it is above the average for Sri Lanka, India, and the UK. If you see your targeted country in the red zone, then you should consider improving the performance of your site for that region. You can explore options like Content Delivery Network or switching your server location.
Tools to Test Website Speed
Also, see our guide on tools to test your website’s performance.
Google Webmaster Tools Search Console
Google crawls your website continuously every day and provides some statistics that you can find in Google Search Console. Go to Settings → Crawl → Crawl Stats. There is a graph that shows the average response time to download the page. This metric often provides a good indicator of the base performance of your website.
Real User Monitoring with Google Analytics
The easiest way to get real performance data from your website’s visitors is to use the Speed Reports in Google Analytics. They are, by default, configured to sample only 1% of your website traffic, which for most websites means that the data is useless by default. You will therefore have to increase the SiteSpeedSampleRate to, for example, 50% or 100% to get useful metrics (adjust it according to max 10 000 page views per day).
To change that, please follow the steps mentioned in this article about tools to use.
Crawlers for Website Performance Test
We use crawlers to get a real view of how websites perform. By crawling all pages of your website, you will easily be able to identify page types or specific pages that perform worse than others. We have made configurations that exclude all front-end-related performance metrics for the results in this article. The obsessive focus on back-end performance is what, in the end, will allow you to build a fast front-end.
- Sitebulb (Full free trial available, this is a tool worth subscribing to – it is evolving at great speed)
- Screaming Frog SEO Spider (What we have used for the average response time graphs below, paid application with a focus on SEO)
Improvements that Can Affect All the Websites
When you have turned off caching, and you can touch and feel the real performance of your website and start tracking some real user performance metrics – you are ready to start implementing improvements that affect the performance of your whole website.
At the end of the day, investing your time in solving general performance issues will make your work a lot less – and give you much better results in terms of web performance than by trying to solve performance issues for only parts of your site.
Every website is unique, but here are a few tips on how to improve the performance of your visitors:
- Switch to better hosting – Servebolt delivers out-of-the-box performance that outpaces any VPS or Cloud instance.
- Use hosting that is close to your audience
- Use modern PHP 7.4 (or at least 7.2+)
- Use databases in the right way (you should especially make sure that queries use indexes properly)
- Use faster databases
- Get rid of dead weight in your application (remove plugins and clean up)
- Fix bugs – in your back & front end (you wouldn’t believe the impact bugs have on performance)
You can identify back end bugs using Crawl Reports
Final Thoughts
It is crucial to test your website for performance correctly, as performance has now become a key metric for ranking, followed by conversion and retention. Although several online tools can show the numbers like page speed and page size, that only gives you a birds-eye view of what is actually causing the performance issues.
Apply the tools and techniques you learn in this article to investigate the underlying performance issues and optimize your website for true performance.


