The conventional methods of testing your website for performance do not reveal the true underlying performance issues. The majority of the users run the website speed test for the front-page of their site only and also re-run the test several times that produces inaccurate results that conflict with the real experience a user gets while browsing the website.
Ideally, you should run a website speed test for performance for the worst-case scenarios, for example, test the performance on a slow network (applies mostly for mobile users), from a location that is far away from your server’s physical location to test out the latency, and without cache activated to see the true performance of your website.
In this guide, you will learn methods of testing your website for actual performance issues.
Table of Contents
Do Not Rely Just On Cache for Performance
The cache is only a performance enhancement. You can not rely completely on cache for your website’s performance. Firstly, because the cache is only viable when it is pre-filled. It does not work for the first request. Therefore, when you re-run the performance tests, you start receiving better numbers that give you a false perception of having a fast website. Secondly, the cache expires at some point and it needs to be re-built to cache the web assets again.
A full-page cache is the most common type of cache that helps in saving server resources but it can not give the immediate performance boost your website needs to stand out. A full-page cache can help with scaling and if your site largely consists of static pages. In more dynamic sites, a full-page cache has very little impact on performance.
Use Chrome Developers Tool For Website Speed Test
You can use Google PageSpeed Insight or Pingdom to test the performance of your website. Similarly, the Chrome Developers tool has a built-in feature that allows you to run a performance test.
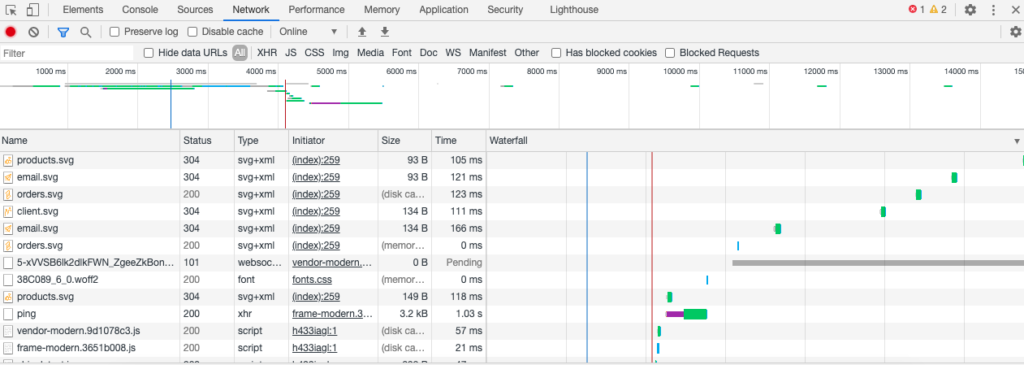
Inside the Network section of the Chrome DevTools, you can record the requests on page load and see the detailed analysis presented inside the Waterfall chart. You can also save logs, capture screenshots to see what users see when they are waiting for your page to load, and emulate offline mode.
Simulate Real User Experience Using A Cache Buster
It is quite possible that the visitor visiting the site for the time is not served with the cached version. Therefore, it is important to test the site’s performance without caching.
To do so, use the cache buster parameter in the URL before running a test using Google PageSpeed Insight or Pingdom, to bypass caching that otherwise can alter the test.
For example, if you are running a test for https://example.com, add ?cache=busted as a parameter at the end of the base URL.
If you need to re-run the tests several times, add a unique number after busted.
First test: https://example.com?cache=busted2
Second test: https://example.com?cache=busted3 and so on…
Chrome DevTools also has a feature to disable cache inside its Network section. It disables the browser cache to emulate the first-time user experience and in some cache configurations like Cloudflare’s Automatic Platform Optimization (APO), it also bypasses the server/proxy cache.
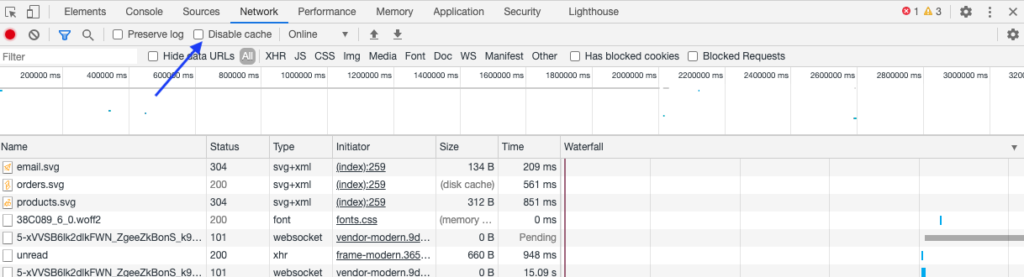
Similarly, you can also clear the browser cache manually using the same window.
Use Google Analytics to Assess Pages Performance
In the real world, visitors enter your website through random pages. They might enter your site from a search engine where any page can come up against a specific search, or a link shared on social media or your blog post from an external link. In short, visitors can enter your website from any random page which means the entire site needs a website speed test and not just the front-page. The simplest way to check this is to use Google Analytics that can show the number of visitors visiting each indexed page of your website.
Head over to your Google Analytics account → Behaviour → Site Content → Landing Pages.
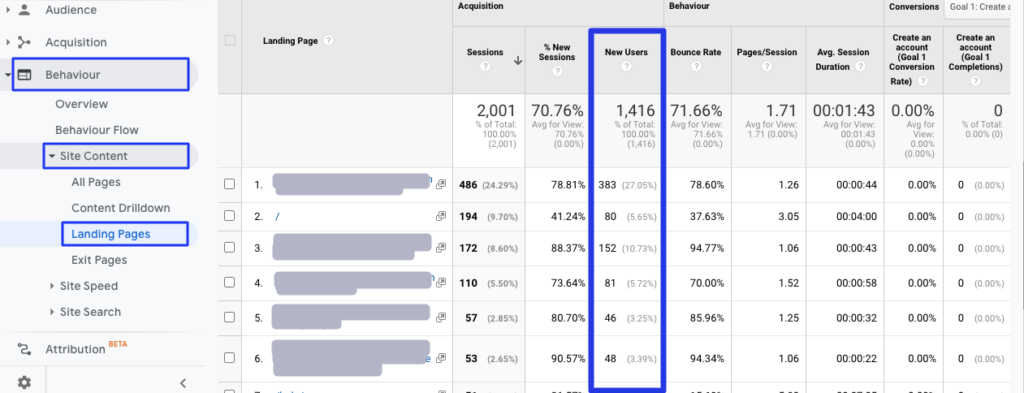
As you can see that every page has a certain number of New Users and even for the landing page you can get the numbers for the new versus returning users. For the new users, the assets are not cached, hence, relies on the website’s native performance.
How to Actually Test a Website For Performance?
Check Performance Using Google Search Console
To begin with, explore the Google Webmaster Tool, now known as Google Search Console that contains information about the crawled pages. Here you can find the statistics recorded by Google bots when crawling your website.
Go to Settings → Crawling → Crawl stats.
Crawlers crawl your website very frequently and it is quite possible that some days they encounter a full-page cached version and show a variation in data. Therefore, looking at the average response time for the last 90 days makes more sense. If the average response time is above 500ms, there is a lot of room for improvement.
Besides Site Speed, Google Analytics also has the feature to check the Core Web Vitals of your website. This is the data gathered from the experience of real users visiting your website.
Use Real User Monitoring (RUM) by Google Analytics
Google Analytics is equipped with tons of useful features and it is no longer just an SEO tool. Speed Report inside Google Analytics reveals real performance data from your website’s visitors. By default, Site Speed Sample Rate is set to capture data of just 1% of all the traffic which might not be sufficient. You can, however, change that to 30%, 50%, or 100% inside Universal Analytics Code present under the website’s header.
To change that, add the following code.
ga(‘create’, ‘UA-XXXX- Y’, {‘siteSpeedSampleRate’: 100});The number after siteSpeedSampleRate refers to the sample size.
If you are using the latest Google Analytics 4 property then you can either hook it up with your existing on-page tag using the Google Analytics admin area or by adding Global Site Tag (gtag.js) file and add the siteSpeedSampleRate like this:
gtag('config', 'G-XXXXXXXXXX’, {‘siteSpeedSampleRate’:100});To fetch this data inside Google Analytics, go to Behaviour → Site Speed → Overview.
The above graph shows the average page load time the set sample group experienced on a website. It is not limited to that. When you scroll down further you will see the browsers the sample was using and the countries they were browsing the site from.
Use Crawlers to Test the Performance
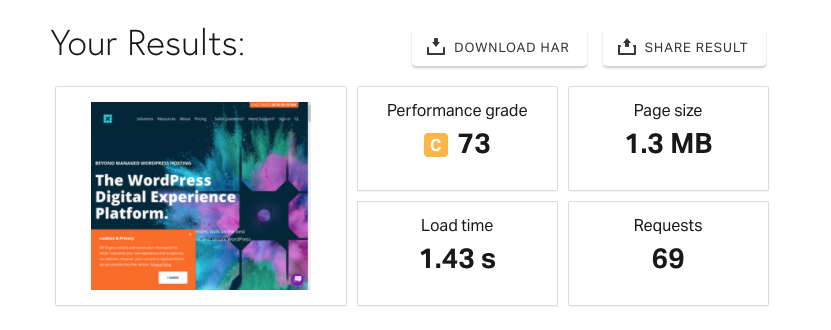
There are third-party tools available that crawl your site for a website speed test and generate a detailed analysis report. These crawlers crawl your entire site to highlight performance-related issues along with useful tips and suggestions to improve them.
Two tools that we have tested are:
Work to Improve time to first byte (TTFB)
Time to first byte (TTFB) is the single most important thing when it comes to enhanced user-experience. It determines the overall performance that the user will experience while browsing your website. If the first request is slow, the rest of the experience will also feel sluggish. A user expects things to happen almost instantaneously which is only possible with a fast TTFB.
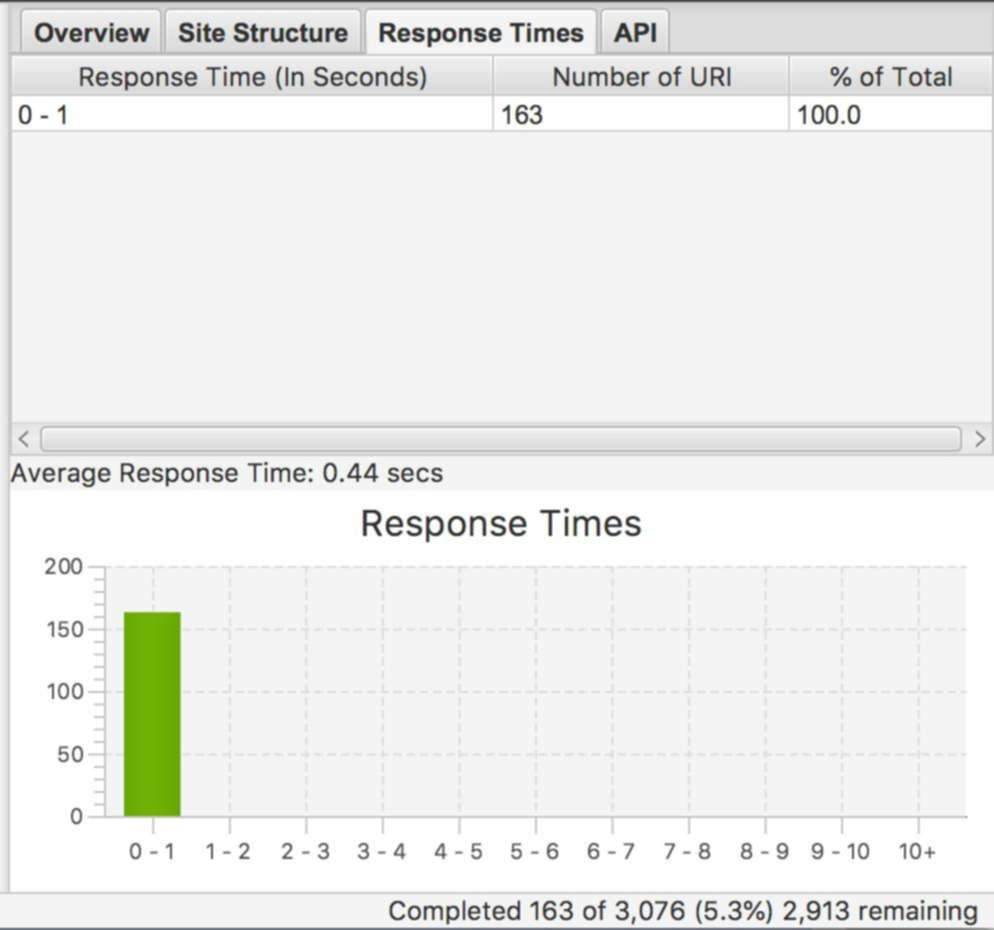
To avoid noticeable delay, you have approximately 400ms to start rendering the page for the end-user. A majority of the webmasters only optimize the front-page for a fast TTFB. Websites that rely on caching for performance usually have the following load distribution.

The small subset of pages that fall under 0 – 1 second are usually cached. On the other hand, the majority of the pages load in between 2 – 3 seconds that shows serious performance issues. However, this is not the standard as several slow sites can have 90% of their pages under a 0 – 1 scale. Therefore, running a thorough audit is important.
Conclusion
Run a website speed test for every possible performance-related issue is significant to optimize it for enhanced user-experience. The conventional methods of testing the website performance do not reveal the underlying issues, hence, knowing the tools and techniques mentioned in this guide is viable for an effective performance audit.