The Crawl Stats Report in Google Search Console aggregates data from Google’s experience while crawling your website. This report is a hidden gem, only available from the site’s Settings page in Google Search Console.
Not using Google Search Console yet? Just start here – it’s easy to get up and running.
The easiest way to make Google like your website, is to make sure that it is fast and has few bugs. A slow site with bugs will be hard to make sense of for Google, and you’ll end up losing your rankings in the SERPs (Search Engine Result Pages).
In this article we show you what problems you can identify and solve using the Crawl Stats Report.
Table of contents
Website Response Time
Every visit to a page on your website starts by letting the user wait for delivery of the page. This waiting period is what we call response time. You obviously want the response time to be as low as possible. To achieve low response times you will need fast hosting.
Many hosting companies will tell you that caching is the solution to response time problems. This may sometimes be true, but wouldn’t it be great to have a way to identify whether or not your website’s response time is good enough?
Google’s crawler visits your website continuously and follows all links that are in your sitemap, on the internet and on your website. They visit just about every page and link that exists to your domain. Hosting companies teach you to test the performance of your website using a single URL in the testing tool. The issue with this is that single-page testing doesn’t really make sense, because it only provides a snapshot of that single page.
Keep in mind that the report is several days delayed, so visit it every other week to keep in touch with your site’s current performance.
Response Time in the Crawl Stats Report
You would like to know what response times a random visitor experiences. The good news is, Google is that random visitor – and they make a beautiful, but very hidden report!
In Search Console, go to “Settings” close to the bottom in the left column. In the Crawling section, you’ll find the button “Open Report” for Crawl stats. When the report is open, you can tick the “Average response time (ms)” checkbox to add the metric to the chart.
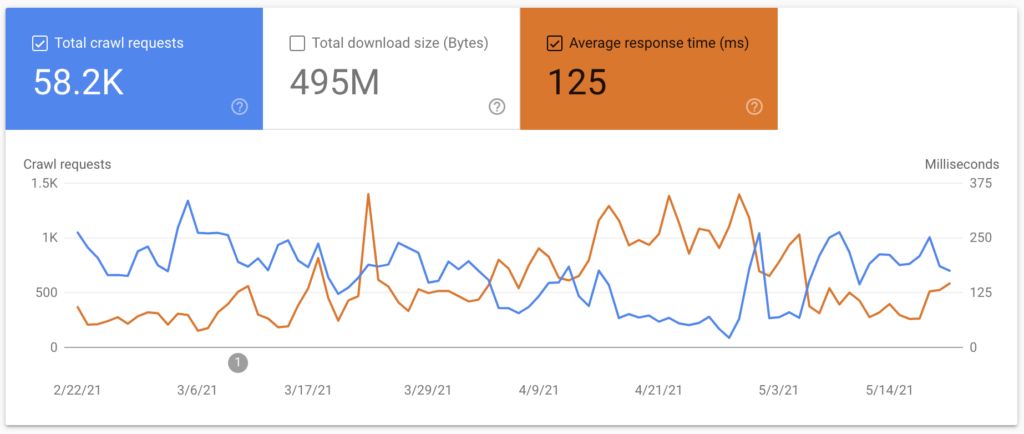
Google is using 200ms as the threshold value in other tests and reports, before they display a warning that your response time is high. Response time will vary depending on your hosting, the quality of the site and the general caching and CDN setup.
What can you do if your hosting provider tells you your caching is working, but the response time number in this report is still high? You’ll have to get better hosting, add Accelerated Domains or hire a developer to optimize the code of your website. After switching to faster hosting, or implementing technical fixes – the response time Google experiences should drop.
Identify Website Issues with the Crawl Request Breakdown Report
On the same page you will find the Crawl request breakdown report. This report is clickable, and provides an overview of the HTTP response codes that Google has encountered while crawling your website. The report will look something like this:
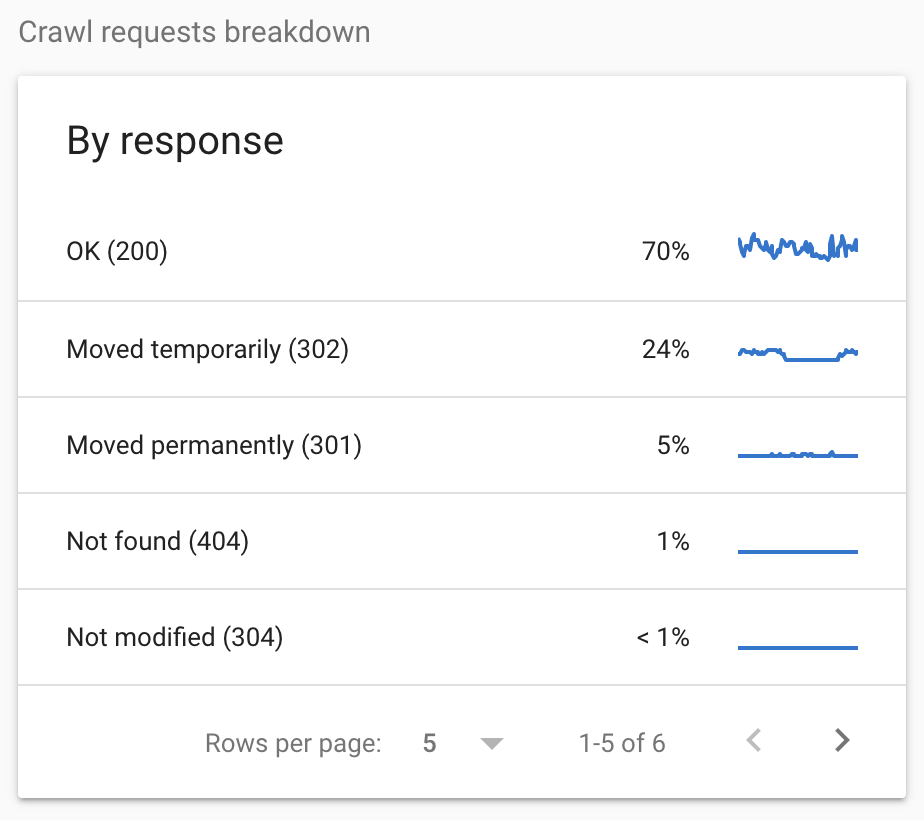
The things to watch out for in this report are errors. There are many different error codes, 404 Not found, 500 Internal Server Error, 502 Bad Gateway 504 Gateway Timeout and so forth. If there are errors, you know with certainty that at least Google experiences this. That usually means that you also have website visitors that are experiencing the same.
Let’s discuss what, why and how to deal with these types of errors.
404 Not found
What 404 requests should you worry about? If you inspect the report and Google reports 404 requests that are pages which you have on another URL on your website, you should add a redirect, so the next visitor will get a 301 redirect to the new location.
It’s not always easy to figure out why a request is made, but that doesn’t really matter much. Either way there exists a reference to this page somewhere. If you provide a redirect instead, the next visitor will get the correct experience.
500 Internal Server Error
If you have internal server error requests in the report there is good reason to start some investigations. The report will provide you the URLs in question. The 500 Internal Server Error indicates that something went wrong in the processing. This can for example happen when the site runs out of memory.
No matter the reason, this is something that should not happen. Talk to your hosting provider about what the possible causes can be.
Page could not be reached, 502 Bad Gateway and 504 Gateway Timeout
Bad Gateway and Gateway Timeout are common errors if the back end web server fails to respond. These errors can happen for all websites where the hosting stack uses a reverse proxy. Using a reverse proxy is very common. On many php-fpm based hosting platforms, these errors will start showing if you exceed the limit and run out of PHP Workers.
Timeout and gateway errors are often related to the current resource usage of your site. For example while your site is experiencing traffic spikes, these types of errors may start showing.
This reporting dashboard is amazingly storing several months of recent data. Therefore, you can drill down and identify issues that happen randomly. This is often difficult to do in real-time, but here you will both get a time and date of the failure, along with the URL.
Crawl stats Crawl requests: Server error (5XX)
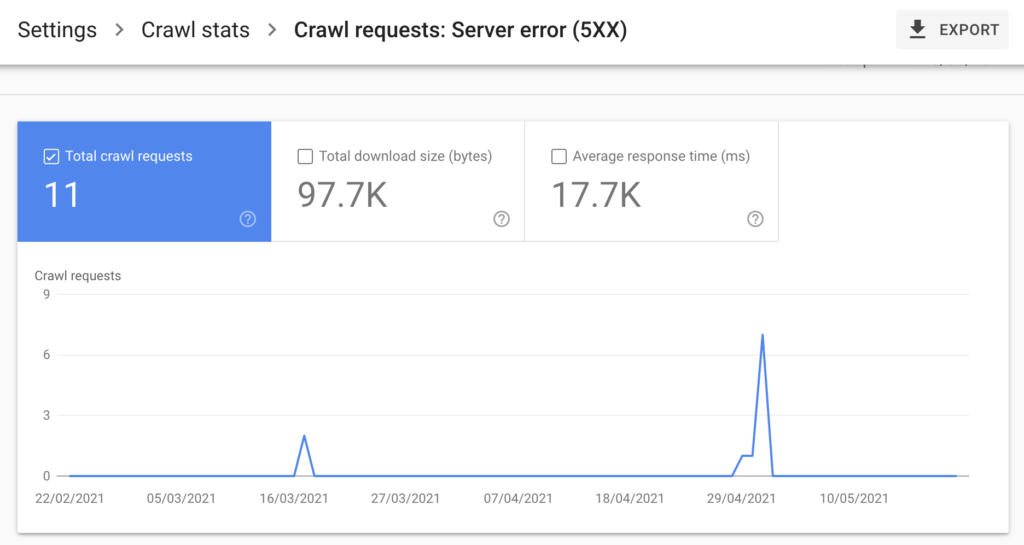
If your Server error (5xx) report looks something like this, you should investigate. Although the number of relative requests is very small, they are still failed requests. Also – the two spikes likely indicate that there were more users that experienced issues on your website, just like Google did while indexing.
The general rule should always be to eliminate errors entirely. If you see problems in your report – talk to your developer or hosting provider about how to get it resolved.