Relational databases, like MariaDB and MySQL, are used to store data in a structured way, which allows use to use SQL (Structured Query Language) to work with the data. It is a common misconception that an increasing database size also will make it slower. If the database can make use of database indexes while querying the data, the database size is almost irrelevant.
Either way, lacking use of indexes is the most common cause for degraded database performance. So how can you figure out if missing database indexes is a problem on your website?
Slow database queries are logged to the mysqld.slow.log, along with an analysis of the database query that can provide valuable additional information. The slow log can usually be found in /var/log/mysqld.slow.log on UNIX systems, or if you’re using shared or managed hosting services, you can ask support for a copy.
Examples
Because this sort of issue comes in many flavors, we’ll be adding examples to this page as we discover them. This should help you learn how to identify and fix the missing database indexes issue.
Example 1: Speeding up a delete query with a range condition
In this example a logging plugin for WordPress does garbage collection (which is good) by deleting old activity log records. From the query analysis we can read that the query spends 2.455565 seconds.
Long query time is not an issue per se. This would usually not be a problem, because it would be sufficient to do this job once in a while as a background task. This plugin, however, seems to be running garbage collection all the time (many times per minute when under traffic).
The reason the query was discovered, is that the database size now has grown to a point where scanning the whole database table is taking so much time that it is noticeable. With an index, the expected query processing time would be linear (and super fast) rather than increasing with table size.
# User@Host: mydatabase[mydatabase] @ localhost []
# Thread_id: 29102268  Schema: mydatabase  QC_hit: No
# Query_time: 2.455565  Lock_time: 0.003255  Rows_sent: 0  Rows_examined: 1900368
# Rows_affected: 0  Bytes_sent: 11
#
# explain: id   select_type     table   type    possible_keys   key     key_len ref     rows    r_rows  filtered        r_filtered      Extra
# explain: 1    SIMPLE  wp_aryo_activity_log    ALL     NULL    NULL    NULL    NULL    1885460 1900368.00      100.00  0.00    Using where
#
SET timestamp=1604223100;
DELETE FROM `wp_aryo_activity_log` WHERE `hist_time` < 1599010297;
From this slow log entry we can read that:
- The query spends multiple seconds of CPU time (Query time 2.45s)
- The database does not find any relevant indexes that can be used (
possible_keysis set toNULL) - The database does not use any indexes (
keyis set toNULL)
When we look at the condition we see that it is a comparison that could benefit from having an index on the hist_time column. Because this does not exist (possible_keys is NULL), we just make such an index:
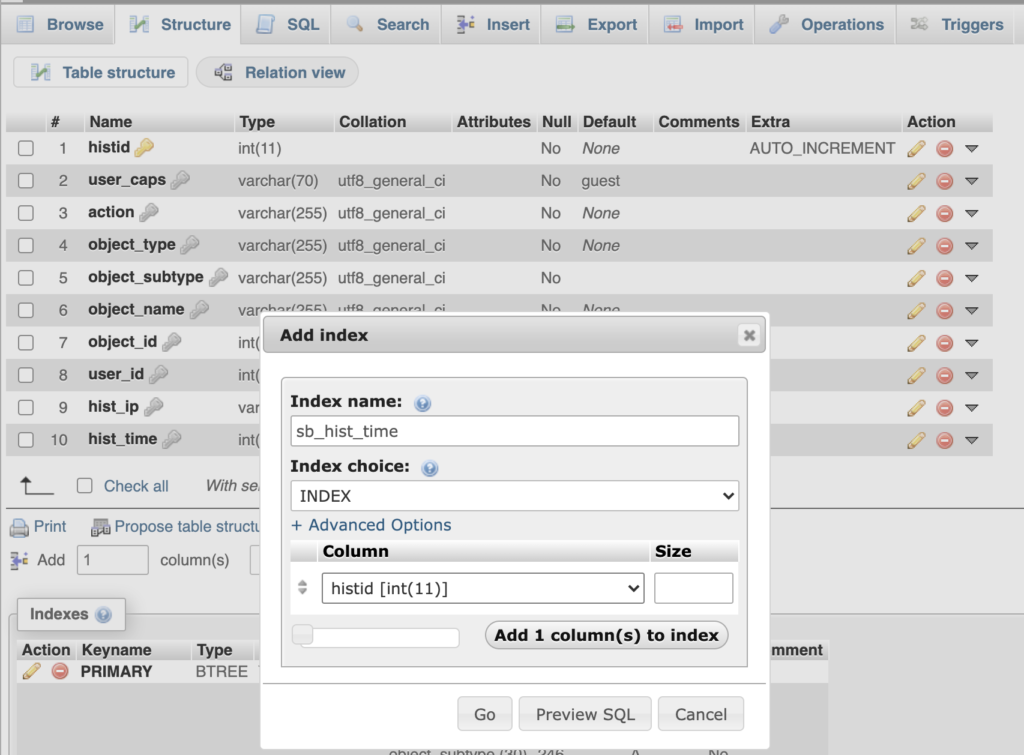
In the image above, we make an index called sb_hist_time (you can name it whatever you want, that does not matter for how it works). The index type should be INDEX, and we add only the histid column to our index. With this configuration, we hit “Go” and wait for the index to be created. Depending on the size of the table and complexity of the index created, this may take some time.
With this index in place, we first verify that the query will be using the index.
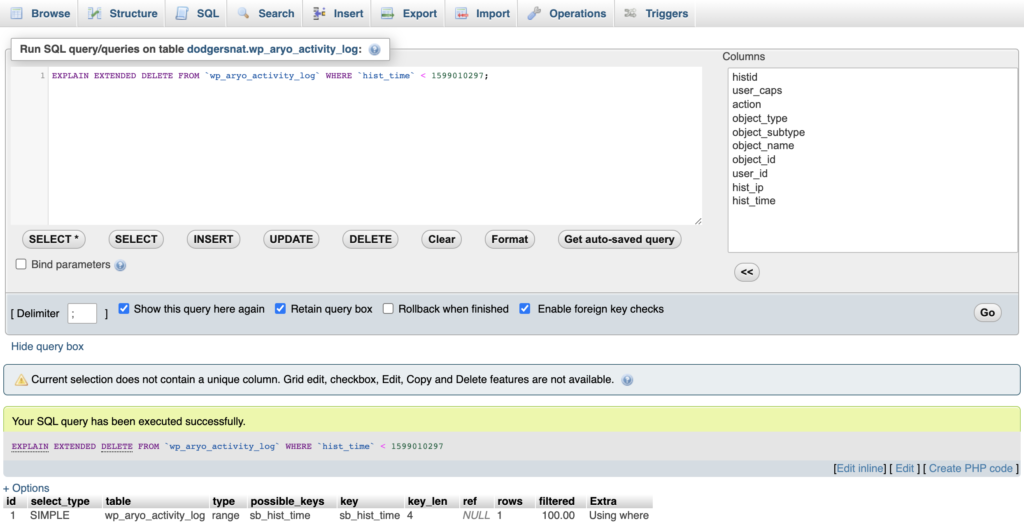
EXPLAIN EXTENDED to confirm that the query is using indexes.As we can see from the query analysis provided by EXPLAIN EXTENDED, the query now has the sb_hist_time index available (possible_keys) and also makes use of the index (key).
To check whether this actually improves the query speed, we can just re-run the delete query in phpMyAdmin. Because we know this delete query has been executed before, and only deletes outdated log entries, we’re not afraid of re-running it.
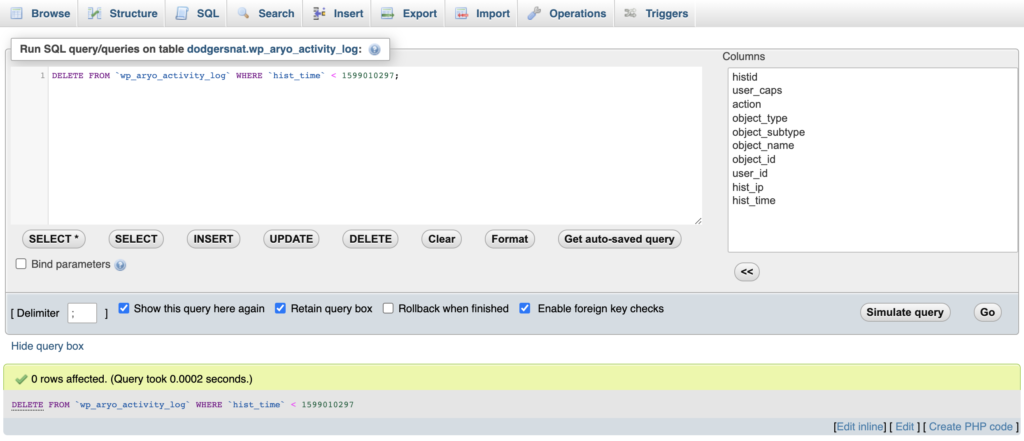
As we can see from the image above, the delete query is now executed in a microsecond fraction of a second instead of a couple of seconds.
In this example, adding these indexes is band-aid rather than a fix. We’ll also be reporting the excessive garbage collection issue to the plugin developers so that they can do that less often. If they ran garbage collection once a week triggered by cron, adding this index would be unnecessary.
Example 2:
In this example, some WordPress plugin or theme is selecting data from the WordPress core posts table called wp_posts. This has likely been a problem for a long time, but this query is also getting slower as more posts are added to the table.
As we can see from the following entry in the mysqld.slow.log, the Query time is now at 1.528947 seconds. We know that this query is running on certain pages in the front-end, meaning the user that visits a page that includes this request has to wait for this query to finish before they get the page delivered.
We can see that there is one suggested index to use, the type_status_date (under possible_keys).
# Time: 201102  4:21:20
# User@Host: demodb[demodb] @ localhost []
# Thread_id: 2902669  Schema: demodb  QC_hit: No
# Query_time: 1.528947  Lock_time: 0.000029  Rows_sent: 0  Rows_examined: 684507
# Rows_affected: 0  Bytes_sent: 82
#
# explain: id   select_type     table   type    possible_keys   key     key_len ref     rows    r_rows  filtered        r_filtered      Extra
# explain: 1    SIMPLE  wp_posts        ref     type_status_date        type_status_date        164     const,const     342255  684507.00       100.00  0.00    Using index condition; Using where
#
use re7elementor5;
SET timestamp=1604308880;
SELECT ID FROM wp_posts WHERE guid='//mediastorage.mywebsite.com/media/10E230F-75205-4F6E-908F-83E0E85F2853.jpg' AND post_type = 'idx_attachment' AND post_status = 'inherit';
The condition (the part after WHERE) in this query selects data using three fields: guid, post_type and post_status. For this, it tries to use the type_status_date index. We know the query is slow, so the assumption is that this index is not the best fit for this query.
In phpMyAdmin, navigate to the database and select the table we want to inspect, wp_posts in this example. Then click Structure in the top menu, and scroll down to the indexes section.
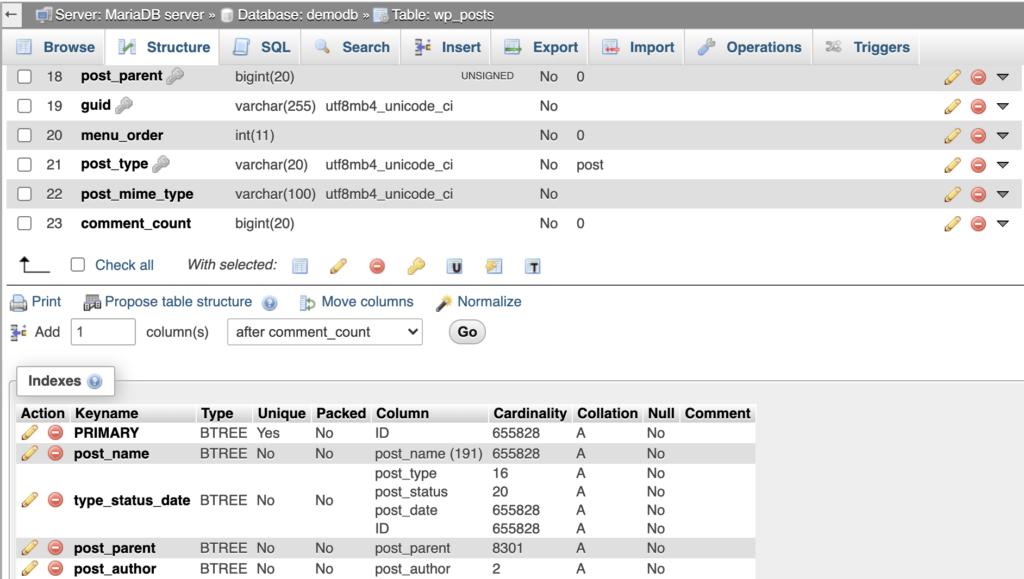
As we can see here, the type_status_date index is made from type, status, date and the ID.
If we again look at our query, we see that guid is not part of this index, and that only post_type and post_status can be used. If you’re familiar with WordPress, you’ll know that filtering by type and status will likely still provide a very large data set.
Because guid is largely unique, we’ll need to have it indexed if we want this query to go fast. So let’s make an index, tailored for this query.
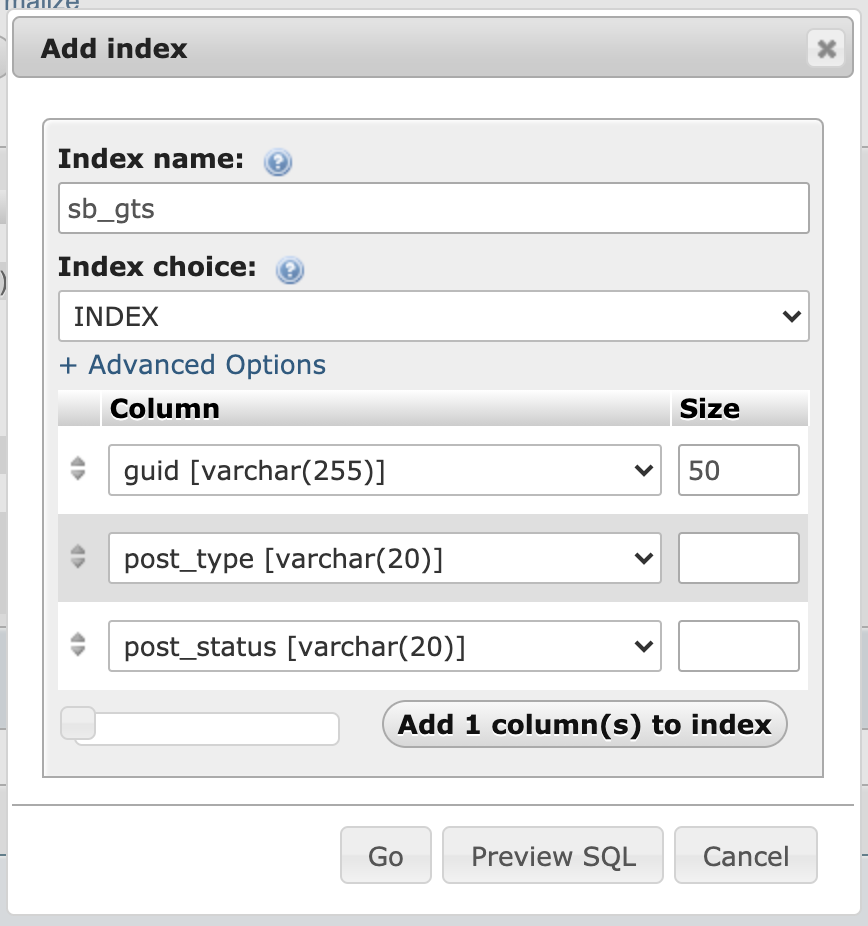
SELECT ID FROM wp_posts WHERE guid='//mediastorage.mywebsite.com/media/10E230F-75205-4F6E-908F-83E0E85F2853.jpg' AND post_type = 'idx_attachment' AND post_status = 'inherit';Below the existing indexes “Create an index on 3 columns” and hit Go. We’re naming the index something that describes what it is, and select INDEX as Index type.
Index size matters, we want to keep indexes small and efficient. Large indexes both take up a lot of storage, and take time to maintain. If you have many indexes, database queries that trigger changes to indexes will be slower.
Columns of type varchar(255) means that the data length of the guid column can contains 255 characters of data – which is a lot. For an index to be efficient, not all data is required. Therefore, in this example we select a “Size” 50. Because the 50 first characters of any guid string, will be “fairly unique”. The logic here is that all entries, in this case, start with //mediastorage.mywebsite.com/media/, which takes up 36 characters. The following 14 characters will largely be random and make the entries unique, and therefore make a speedy index.
In addition, we add the post_type and post_status and hit Go. Wait for the index to be built, this may take some time on a large data set.
After this, it’s time to check if the index works. In this case we did that by observing that this query suddenly was no longer visible in the mysqld.slow.log. Also, the load on the server suddenly dropped. The other ways to test it is to just re-run the query to check how fast it is processed, and to check with EXPLAIN EXTENDED prior to the query (See end of Example 1).