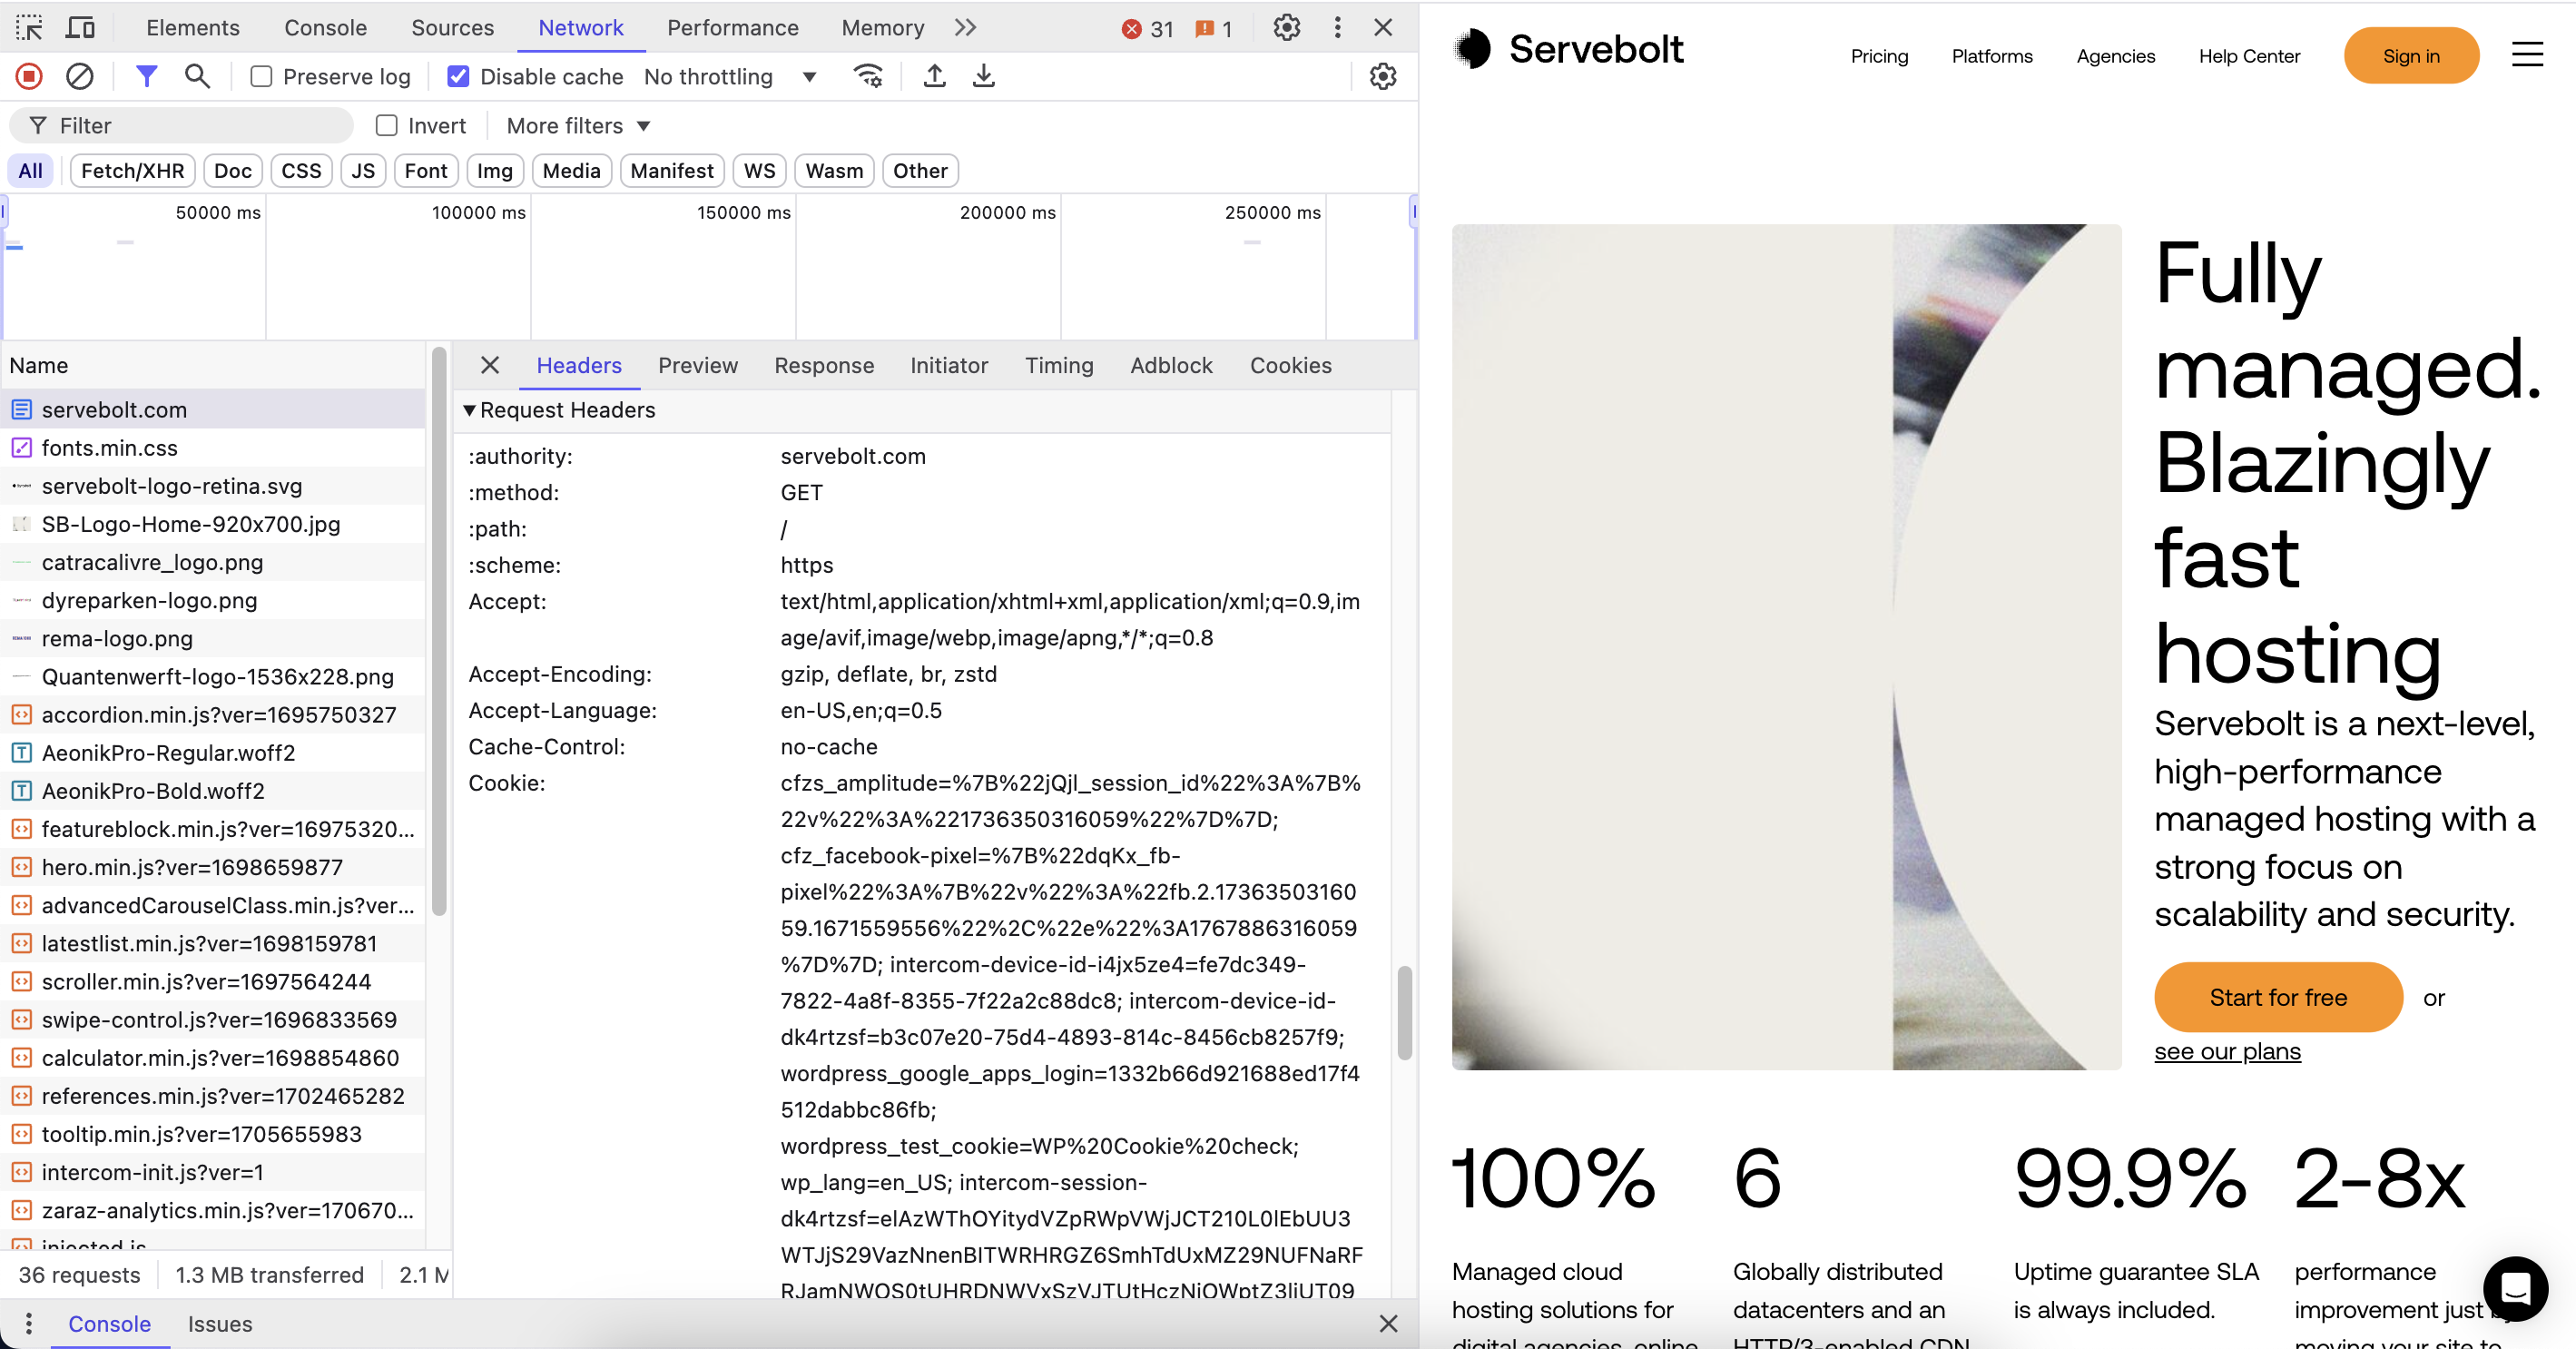
Request headers are a vital component of HTTP requests, providing information such as content type, user agent, and authentication details. Debugging or understanding these headers can help identify issues or optimize requests, especially for developers or web performance enthusiasts. Here’s how to inspect and retrieve request headers in most modern browsers.
Why Inspecting Request Headers is Important
Viewing the request headers is helpful for several reasons. Following the steps in this guide, you can easily access and analyze request headers in most modern browsers. The request headers can be very useful when:
- Debugging API integrations.
- Identifying caching issues.
- Diagnosing user-agent-specific problems.
- Understanding security configurations like
AuthorizationorCORS
Ready to experience 2-8x faster speeds? Try us risk-free today!
Speed matters. Our hosting helps you convert more visitors with lightning-fast website performance.
Start for freeInspecting in Chrome, Edge, or Brave
- Open Developer Tools:
- Windows/Linux: Press
F12orCtrl+Shift+I - Mac: Press
CMD+Option+IorCMD+Shift+C - Alternatively, right-click on the webpage and select Inspect.
- Windows/Linux: Press
- Navigate to the Network Tab:
- Click the Network tab in the Developer Tools panel.
- Reload the page if the tab was opened after loading the site to capture all requests.
- If you’re checking cache headers, it’s a good idea to disable cache ✔️
- Select a Request:
- Locate the request you’re interested in from the list of network requests. Requests are grouped by type (HTML, CSS, JS, etc.).
- View Headers:
- Click on the request to open its details panel.
- Go to the Headers tab to view:
- General Information (e.g., request URL, method).
- Request Headers (e.g.,
User-Agent,Authorization).
- Copy Headers (Optional):
- Right-click within the Headers tab and select Copy > Copy Request Headers to copy them for later use.

Tip: To change the ‘dock side’, click the three dots (…) in the top-right corner of Developer Tools and select the vertically split view.
Firefox
- Open Developer Tools:
- Windows/Linux: Press
F12orCtrl+Shift+I - Mac: Press
CMD+Option+IorCMD+Shift+C
- Windows/Linux: Press
- Navigate to the Network Tab:
- Click the Network tab.
- Reload the page if necessary to capture all requests.
- If you’re checking cache headers, it’s a good idea to disable cache ✔️
- Select a Request:
- Choose the request of interest from the list displayed.
- View Headers:
- Click on the request to see its details.
- Go to the Headers section to view both Request Headers and Response Headers.
- Export Headers (Optional):
- Right-click on the headers and choose Copy Request Headers for export.
Safari Web Inspector
- Enable Developer Features:
- If not already enabled, go to Safari > Settings > Advanced and check ✔️ Show features for web developers.
- Open Developer Tools:
- Press
CMD+Option+Ior click Develop > Show Web Inspector.
- Press
- Navigate to the Network Tab:
- Select the Network tab and reload the page to capture requests.
- Select a Request:
- Click on the desired request.
- View Headers:
- Go to the Headers section to inspect the Request Headers.
Further Reading
You now have the tools to view and inspect request headers for any HTTP request. To keep exploring and continuing the learning, check out these related topics:
As always, should you have any additional questions, please don’t hesitate to contact us through our support chat at servebolt.com!
