Google’s Search Console (previously Google Webmaster Tools) gives you continuous feedback from Googlebot, their search engine crawler. Googlebot regularly visits your website and collects extensive amounts of information. This data is processed and aggregated in the Google Search Console dashboard.
If you haven’t used the Search Console before, there’s nothing to be afraid of – just start using it, it’s free. Make it a habit to visit the Search Console every now and then!
Table of contents
Google Search Performance
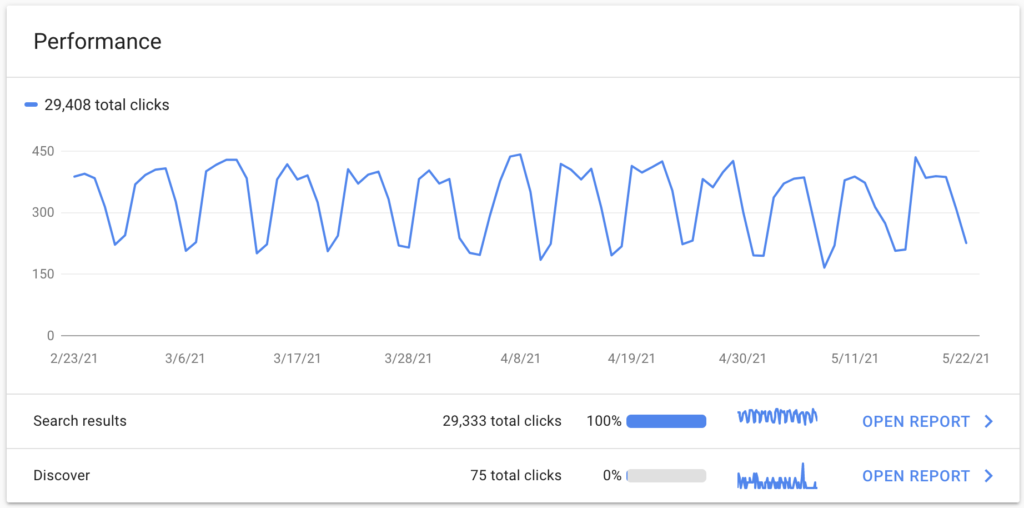
The default view is the “Performance” view that aggregates your clicks from Google search results and Google Discover. Both reports can be inspected individually, providing more extensive information about click through rate, position in SERPs (Search Engine Result Pages), total impressions for what URLs an so forth. There’s a lot of useful search engine performance data to dive in to.

User Experience
Your website’s technical health has an impact on both search rankings and the user experience. The User Experience section in Search Console aggregates a set of technical measures; Core Web Vitals, SSL, Mobile Usability, Security issues and Ad experience. Core Web Vitals is the latest big addition in the Search Console, and with that Google finally made a solid push towards linking end user experience to search results.
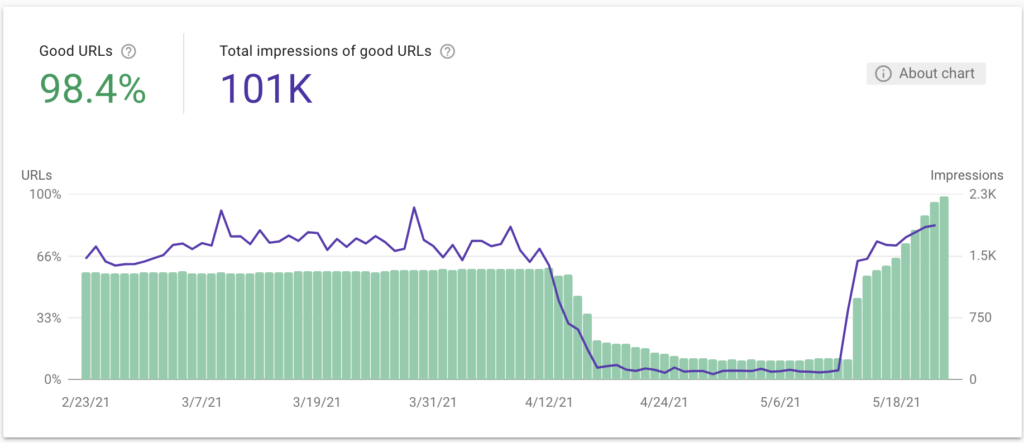
The following Page Experience graph is interesting, because the experience on this website suddenly started dropping. Several weeks later, you can see on the graph that the number of Good URLs is getting back to the level where it should be – close to 100%.

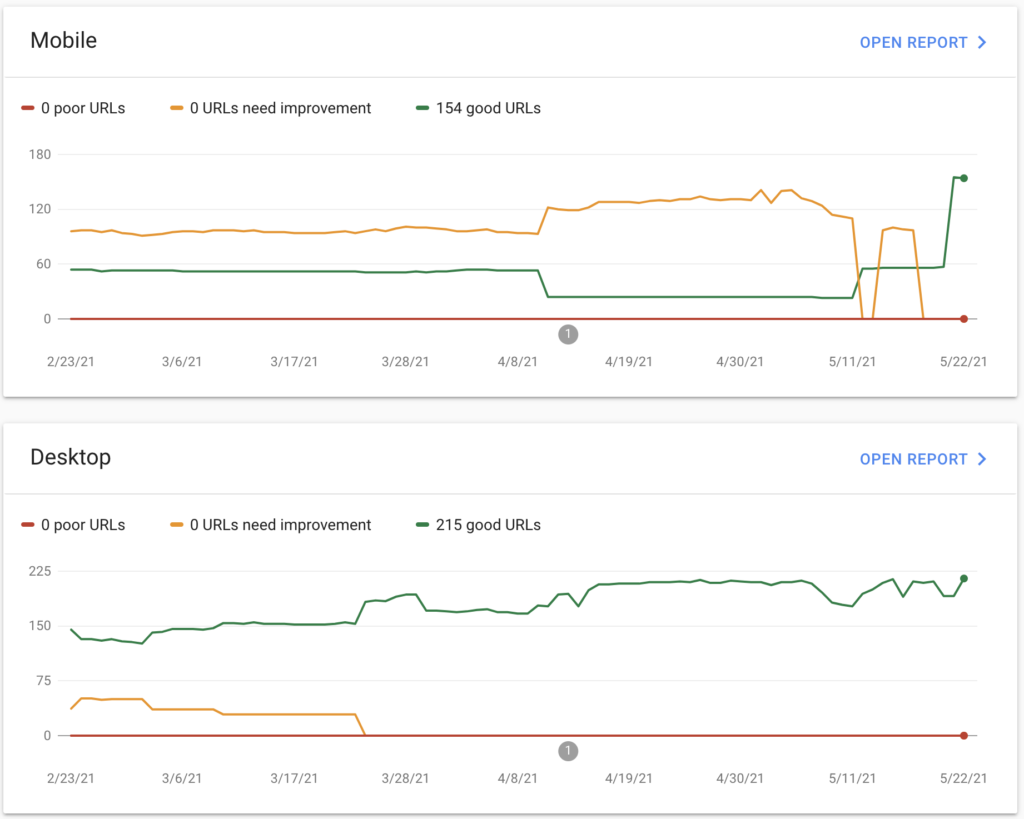
There’s also the detailed Core Web Vitals view, that’s split into Desktop and Mobile performance. It’s common to have better performing web vitals on desktop, but you should always aim at providing as many good pages as possible. This graph is from the same website as the Page Experience graph above. The data in these dashboards is a few days delayed, so be patient after implementing fixes.

Crawl Stats Report
A hidden gem in the Search Console is the Crawl Stats Report. This report will allow you to check whether or not your website’s response time is acceptable, or not.
