
Servebolt once again secured the Top Tier award in the WordPress and WooCommerce Hosting Benchmarks. The WooCommerce category was first introduced last year, and this is the second year our WooCommerce-managed hosting was tested and performed with amazing results!
Servebolt earned another Top Tier award this year. 99.999% Uptime. The fastest Load Storm average response time. Also the fastest wp-login, Buyer and Customer profiles and the second fastest Home profile. A solid K6 test. The second fastest WPT results. The fastest PHP Bench. Clearly a Top Tier performance well earned.
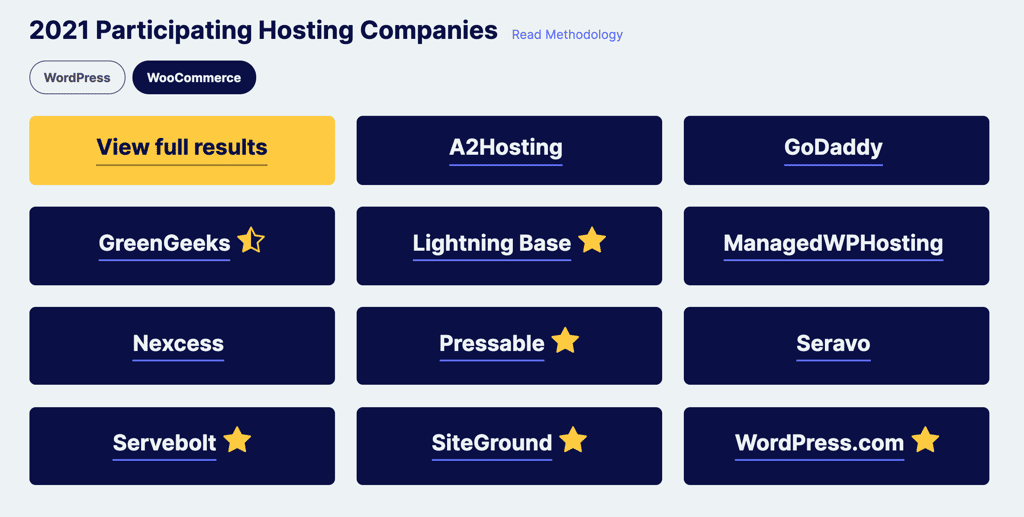
Kevin Ohashi, WP Hosting WooCommerce Benchmarks
This year, 11 companies participated in the WooCommerce category, out of which only 5 secured the full shiny gold star. Compared to the general WordPress category, fewer companies dare to participate in the rigorous WooCommerce benchmark, and only a handful prove to be the Top Tier WooCommerce hosting providers.
In the WooCommerce Benchmark, the configuration of the tests is slightly modified to emulate the behavior of an online shopping buyer. They are aimed at hitting the pain points of WooCommerce sites because such sites are more dynamic and demanding. In the end, the results of each test in the WooCommerce category show how well a hosting provider would perform if a WooCommerce store was hosted on it.
WooCommerce store owners often run into scaling issues of various sorts. One common problem with many competing hosting providers is the limitation of PHP workers, which is also found on WP Engine and Kinsta. At Servebolt, we solve this problem by providing unlimited PHP workers on all our hosting plans.
Stores built with WooCommerce have an increasingly large share of dynamic requests that are required on most page views. While the store owners remain busy with tons of back-end operations like product, price, and stock management, tasks like order handling and other dynamic requests also become challenging for the hosting provider.
Similarly, the store’s front end has much more dynamic activity. Carts need to be updated, wishlists need to be maintained, and alongside that, there are often several integrations running continuously.
There are far-reaching requirements for more server resources. There are also many things that have an impact on speed. The database is significantly more complex and demanding for WooCommerce stores compared to the average WordPress site, with products, possibly with variations, multi-currency setups, or even multi-lingual configurations.
Technically, this often boils down to the performance of the following parts of WordPress. The things that affect front-end speed are (but not limited to):
- Ajax calls (can’t be cached) like cart fragments.
- Cart and checkout.
- Rest API calls.
Testing: How Is It Done?
At Servebolt, we do internal and customer testing of WooCommerce stores a bit differently than how the tests were conducted in this Benchmark. We also use the Load Storm, but we take the tests a few steps further in the sense that we’re always trying to identify how much traffic our customers’ stores actually can handle. People often ask if WooCommerce can handle tens of thousands of products or maybe 100 000 products. The answer to that is undoubtedly “yes,” but to achieve that along with performance goals, scalable high-performance WooCommerce hosting is imperative.
Scalable high-performance hosting is our key competitive advantage. Therefore, had we done the tests, we would have made sure to make proper estimations of expected traffic beforehand and then conducted tests to see if the store would scale to the required limits. You might ask, should there be a limit? Well, every website has a limit as to how much traffic it can handle, and we always run our tests to this limit. This reveals the true capabilities of your WooCommerce store in terms of the maximum amount of page views per second.
In this year’s test, WP Hosting Benchmarks have made a few similar tests to what we typically conduct. Using customer profiles, we generate traffic in our store that is as close to real users as possible. This differs a lot between WooCommerce stores, and the store’s limits are always dependent on the configuration, plugins, and theme.
No matter what angle you take on testing a WooCommerce store, it all boils down to how many dynamic requests you’re able to process. With dynamic requests, we mean requests that hit PHP on your backend web server. The caching part is just a hygiene factor. It has to work, but that part is easy. WooCommerce sites “never” go down because of the caching, it is the performance of the backend that matters.
Our test plan
We participated with our entry-level WooCommerce plan in this year’s WooCommerce test, with Cloudflare Free on top. That means that we did not add HTML caching on the CDN edge, which is especially visible in the cache-related tests (Load Storm Browser Profile) and K6. In spite of this, though, we still managed to get the second-fastest average result on WebPageTest.
To run WooCommerce without HTML caching is completely fine on Servebolt, but in terms of testing, it affects the results. Because every HTML request will be served from the origin server instead of getting the performance gain from being served from the CDN edge. If your market is geographically spread, we usually recommend adding Cloudflare Business or Accelerated Domains to get HTML caching – but the price limit in this tier did not allow for that.
WPPerformanceTester
WPPerformanceTester is a performance test you can run yourself on your WordPress website. What it does is measure how fast your server computes PHP and how fast your database is. The test is split across two measurements: PHPBench measures the speed of PHP, and WP Bench measures how many queries your database can provide a result for in a set amount of time.
| PHP Bench – PHP Execution time | WP Bench – Database Queries per second | |
|---|---|---|
| Servebolt ⭐️ | 3.246 | 1481 |
| WordPress.com ⭐️ | 4.116 | 2500 |
| Pressable ⭐️ | 4.134 | 1408 |
| Nexcess | 4.301 | 1597 |
| A2Hosting | 4.32 | 758 |
| ManagedWPHosting | 5.215 | 1580 |
| Seravo | 5.34 | 197 |
| Lightning Base ⭐️ | 6.632 | 749 |
| SiteGround ⭐️ | 7.385 | 1658 |
| GoDaddy | 10.927 | 277 |
| GreenGeeks | 12.113 | 990 |
Lower numbers are good on PHP Execution time (faster)
Higher numbers are good on WP Bench (more queries per second)
Servebolt, like in the other tests, shows that our PHP is the fastest on the market. We were the only ones who produced PHPBench results below 4 seconds across all hosting providers in the WP Hosting Benchmarks 2021. Our speed was measured at 3.2 seconds, with WordPress.com almost a second slower in second place with 4.1 seconds.
| PHP Bench PHP Execution time | Seconds slower than Servebolt | % more time used than Servebolt | |
|---|---|---|---|
| Servebolt ⭐️ | 3.246 | 0 | |
| WordPress.com ⭐️ | 4.116 | 0.87 | 26.80% |
| Pressable ⭐️ | 4.134 | 0.888 | 27.36% |
| Nexcess | 4.301 | 1.055 | 32.50% |
| A2Hosting | 4.32 | 1.074 | 33.09% |
| ManagedWPHosting | 5.215 | 1.969 | 60.66% |
| Seravo | 5.34 | 2.094 | 64.51% |
| Lightning Base ⭐️ | 6.632 | 3.386 | 104.31% |
| SiteGround ⭐️ | 7.385 | 4.139 | 127.51% |
| GoDaddy | 10.927 | 7.681 | 236.63% |
| GreenGeeks | 12.113 | 8.867 | 273.17% |
The right columns show how much slower in seconds and % compared to Servebolt
Comparing our speed to the average speed really shows the amazing job our R&D team has done and continues to do, to maximize PHP speed. The average across all competitors for PHPBench was 6.1 seconds, which means we’re close to twice as fast.
LoadStorm Testing Results
We see this as the most important of all the tests in the benchmarks. This is where “real users” are simulated, and traffic is generated on the store in a way that tries to mirror customer behavior. What we typically see in the Load Storm test is that some companies that are highly dependent on caching for performance have a good performance on all page views that can be cached while not as good for those that can’t be cached.
There were 4 different profiles made. A profile is a set of page views and actions that simulate customer click behavior.
- Profile 1 (20%): Buyer – Homepage, add the item to the cart, go to cart, checkout (doesn’t submit the order).
- Profile 2 (10%): Customer (existing) – Homepage, login, view orders, view account details.
- Profile 3 (20%): Browser – Homepage, second page, product, related product, homepage, product, related product.
- Profile 4 (50%): Home – Homepage only, called Visitor profile last year.
There are a few metrics to look at specifically in the Load Storm test, which in our view, are:
- Total errors
- Average response time
- wp-login.php average response time
- Average HTML Response Time
- Buyer profile, customer profile, browser profile, and home profile
These metrics tell you a lot about the performance, specifically the cached and uncached performance.
Average Response Time
The Average Response Time is a metric that goes across all profiles. We aced this test. We were 20% faster on average than the second fastest and 2.3 times faster than the average across all participants. We were the fastest even though Pressable, WordPress.com, and SiteGround all seem to have HTML cached on the CDN edge for the Browser Profile.
| Average Response Time (ms) | Error rate | Average HTML Response Time | Total Errors | Peak Rps | Average Rps | |
|---|---|---|---|---|---|---|
| Servebolt ⭐️ | 92 | 0.0011% | 259 | 31 | 1434.7 | 784.66 |
| SiteGround ⭐️ | 128 | 0.0019% | 277 | 48 | 948.42 | 704.91 |
| Pressable ⭐️ | 109 | 0.0002% | 347.6 | 4 | 986.07 | 746.37 |
| WordPress.com ⭐️ | 218 | 0.0028% | 410.8 | 56 | 723.58 | 546.19 |
| Lightning Base ⭐️ | 167 | 0.0024% | 608.4 | 59 | 885.95 | 670.66 |
| A2Hosting | 177 | 0.0476% | 620.8 | 2098 | 1954.92 | 1224.48 |
| GreenGeeks | 181 | 0.0005% | 758.6 | 11 | 843.05 | 640.15 |
| Nexcess | 189 | 0.1070% | 759 | 1249 | 511.75 | 324.5 |
| GoDaddy | 181 | 0.0604% | 565.6 | 3452 | 2359.47 | 1586.73 |
| Seravo | 249 | 20.8270% | 676.2 | 373975 | 707.97 | 498.79 |
| ManagedWPHosting | 652 | 1.5654% | 4928.6 | 20638 | 656.82 | 366.22 |
The average response time, excluding our own result, is 225ms. If you also exclude the two with the slowest average response time (Seravo with 249ms and ManagedWPHosting with 652ms), you get an average response time of 168ms this year. In comparison, we delivered a 92ms average response time and were the fastest of all in this year’s WooCommerce benchmark.
Looking to speed up your WooCommerce store? Read our comprehensive guide on Speeding Up WooCommerce.
WP-Login
The average wp-login.php response time is always a good indicator of a hosting company’s uncached, pure-origin performance. Here we would also like to compare the wp-login.php average response time to the average HTML response time, which includes both cached and uncached requests. A large difference between the two, in most cases, means the hosting is highly dependent on caching and doesn’t scale well.
| Wp-login Average Response Time | Wp-login slower than Servebolt | |
|---|---|---|
| Servebolt ⭐️ | 326 ms | 0 |
| SiteGround ⭐️ | 330 ms | + 4 ms |
| Pressable | 459 ms | + 133 ms |
| WordPress.com ⭐️ | 471 ms | + 145 ms |
| Lightning Base ⭐️ | 728 ms | + 402 ms |
| A2Hosting | 812 ms | + 486 ms |
| GreenGeeks | 935 ms | + 609 ms |
| Nexcess | 949 ms | + 623 ms |
| GoDaddy | 1354 ms | + 1028 ms |
| Seravo | 1560 ms | + 1234 ms |
| ManagedWPHosting | 8832 ms | + 8506 ms |
The wp-login.php response time average across all companies this year is 1.5 seconds (1523ms). Much of that is due to the extremely bad results delivered by ManagedWPHosting, which had an average of close to 9 seconds(!). To be able to compare using averages, we have to exclude them from the calculation. Excluding ManagedWPHosting reduces the average across all companies to 792ms.
We delivered the fastest average wp-login.php response time at 326ms, with SiteGround close behind with 330ms on average. Servebolt and SiteGround were more than 100ms faster on average than the 3rd place Pressable.
We’ve been saying for years that we can serve requests faster dynamically than many competitors do with caching. It’s therefore delightful to see that Servebolt in this test, with the only exception of Siteground, serve dynamic requests faster than all the others deliver average HTML response times, which includes cached results.
Thomas Audunhus – COO at Servebolt
Average HTML Response Time
Another finding to highlight here is the difference between the wp-login.php response time and the average HTML response time. This difference is important because a large difference means the hosting company is highly dependent on caching for performance. The difference between these two measures represents the Added time on average for dynamic requests.
Dynamic Requests are requests that cannot be cached or are not served from cache. For WooCommerce, this includes the cart, checkout, my-account, and more.
If we use GoDaddy as an example. The difference between WP-login Average Response Time and Average HTML Response Time is 788ms, which tells us that GoDaddy is highly dependent on caching and, therefore, is unlikely in many cases to deliver the minimal performance needed to scale a WooCommerce store successfully.
| Company | Wp-login Average Response Time | Average HTML Response Time | Added time on average for dynamic requests |
|---|---|---|---|
| Servebolt ⭐️ | 326 ms | 259 ms | + 67 ms |
| SiteGround ⭐️ | 330 ms | 277 ms | + 53 ms |
| Pressable ⭐️ | 459 ms | 348 ms | + 111 ms |
| WordPress.com ⭐️ | 471 ms | 411 ms | + 60 ms |
| Lightning Base ⭐️ | 728 ms | 608 ms | + 120 ms |
| A2Hosting | 812 ms | 621 ms | + 191 ms |
| GreenGeeks | 935 ms | 759 ms | + 176 ms |
| Nexcess | 949 ms | 759 ms | + 190 ms |
| GoDaddy | 1354 ms | 566 ms | + 788 ms |
| Seravo | 1560 ms | 676 ms | + 884 ms |
| ManagedWPHosting | 8832 ms | 4929 ms | + 3903 ms |
Buyer profile, customer profile, browser profile, and home profile
| Buyer Profile | Customer Profile | Browser Profile | Home Profile | |
|---|---|---|---|---|
| Servebolt ⭐️ | 270 | 270 | 270 | 159 |
| SiteGround ⭐️ | 318 | 288 | 254 | 195 |
| GoDaddy | 391 | 497 | 252 | 334 |
| Pressable ⭐️ | 474 | 410 | 199 | 196 |
| Seravo | 501 | 601 | 579 | 140 |
| WordPress.com ⭐️ | 600 | 452 | 264 | 267 |
| A2Hosting | 736 | 635 | 483 | 438 |
| Nexcess | 742 | 702 | 735 | 667 |
| Lightning Base ⭐️ | 783 | 645 | 479 | 407 |
| GreenGeeks | 1142 | 836 | 473 | 407 |
| ManagedWPHosting | 6238 | 8006 | 784 | 783 |
A home profile and a browser profile are both non-dynamic tests where those with CDN caching will achieve the best results. We came in 5th place on the Browser profile, with an average response time of 270ms, which still is 40% faster than the average. We’re just 35% behind the leading cache in this category. On the Home Profile, we came in second place, only 19ms behind the leader.
Two companies failed this test, Seravo and ManagedWPHosting. This is something that typically will happen when hosting companies have an intensive focus on caching rather than backend performance. When it comes to WooCommerce hosting, being good at caching alone will not get you past the finish line.
Now, let’s look at the WooCommerce-specific Load Storm profiles. Again, to make sense of averages, adding ManagedWPHosting to the mix here isn’t helpful; their result is horrendous, with a buyer profile with an average of 6238ms and a customer profile with an average of 8006ms. Excluding them leaves us with the following averages vs. Servebolt results.
| Profile | Average for all | Servebolt |
| Woo Buyer Profile | 595ms | 270ms |
| Woo Customer Profile | 522ms | 270ms |
| Woo Browser Profile | 398ms | 270ms |
| Woo Home Profile | 321ms | 159ms |
In addition to being twice as fast compared to the average, we were fastest on all WooCommerce profiles except one where we were second fastest.
We are 4-5 times faster than the average across all the companies. For us, this does not come as a surprise because these three profiles are the most demanding of all tests in this benchmark. The Servebolt Cloud’s ability to process PHP faster than anyone else is also reflected in the PHP Performance Tester results, where we are the only company across all of the WordPress and WooCommerce Hosting Benchmark tests that have broken the barrier below 4 seconds of processing time.
Error rate
Total errors are also a very important metric to look at. It says a lot about how the hosting handles the load. This year it’s safe to say that Seravo and ManagedWPHosting did not deliver a steady result under load. Seravo had a 20% error rate, and ManagedWPHosting had 1.57%. That is not something you want as a store owner, as this most likely would decrease your sales by the same percentage (or more). As we look at error averages, it’s vital to exclude these two, as they would significantly raise the average.
The average error rate this year, excluding Seravo and ManagedWPHosting, was 0.024%. Our error rate was 0.001097% and that put us in 3rd place, behind Pressable and GreenGeeks. As GreenGeeks failed on other aspects of the WooCommerce benchmark and didn’t receive the Top Tier Award, we must say we’re quite happy with our result and a top 3 position here.
WebPageTest
The WebPageTest part of the benchmark is a test of the actual loading time across multiple geographical locations. Essentially, it shows how the user experience will be. A few things to remember in this test is that it’s only testing the front page. Almost all environments allow caching of the front page, which is distributed through CDNs and proxies. A lot of pages in a WooCommerce store cannot be cached, but it highly impacts the user experience. Pages like this are the cart, checkout, my account pages, and similar.
In our view, the WebPageTest in the WooCommerce (and WordPress) Hosting Benchmark does not say anything about real server speed. Despite that, the tests do highlight the effectiveness of CDNs and caches.
| Company | Average | Virginia | California | Salt Lake City | London | Frankfurt | Cape Town | Singapore | Mumbai | Tokyo | Sydney | Brazil | Dubai |
|---|---|---|---|---|---|---|---|---|---|---|---|---|---|
| WordPress.com ⭐️ | 1.13 | 0.89 | 0.94 | 1.18 | 0.96 | 0.88 | 2.02 | 0.90 | 1.34 | 0.90 | 1.01 | 0.91 | 1.67 |
| Servebolt ⭐️ | 1.53 | 1.11 | 1.32 | 1.49 | 1.30 | 1.72 | 2.00 | 1.21 | 1.54 | 1.15 | 1.43 | 1.19 | 2.92 |
| Pressable ⭐️ | 1.81 | 1.25 | 1.29 | 1.61 | 1.20 | 1.57 | 3.00 | 1.92 | 2.08 | 1.65 | 2.00 | 1.49 | 2.70 |
| GreenGeeks | 1.92 | 1.19 | 1.34 | 1.48 | 1.44 | 1.41 | 2.91 | 2.26 | 2.34 | 1.73 | 2.21 | 1.64 | 3.08 |
| Lightning Base ⭐️ | 2.01 | 1.35 | 1.46 | 1.36 | 2.15 | 1.85 | 2.62 | 2.31 | 2.62 | 1.50 | 1.97 | 1.72 | 3.22 |
| SiteGround ⭐️ | 2.03 | 1.02 | 1.06 | 1.17 | 1.38 | 1.44 | 2.90 | 2.88 | 3.15 | 2.06 | 2.31 | 1.82 | 3.14 |
| Seravo | 2.04 | 1.62 | 1.96 | 1.93 | 1.10 | 1.06 | 2.64 | 1.75 | 1.54 | 2.56 | 3.32 | 2.41 | 2.63 |
| A2Hosting | 2.16 | 1.30 | 1.70 | 1.77 | 1.51 | 1.74 | 3.02 | 2.70 | 2.47 | 2.13 | 2.44 | 1.89 | 3.27 |
| ManagedWPHosting | 2.49 | 1.44 | 1.96 | 2.10 | 1.26 | 1.06 | 1.95 | 3.97 | 1.83 | 2.58 | 2.70 | 2.00 | 7.03 |
| Nexcess | 3.65 | 1.14 | 1.43 | 4.20 | 2.62 | 2.63 | 3.86 | 4.94 | 7.81 | 3.64 | 5.64 | 2.30 | 3.60 |
| GoDaddy | 3.80 | 2.31 | 2.60 | 2.56 | 3.48 | 3.40 | 7.31 | 3.97 | 5.80 | 2.52 | 4.10 | 2.79 | 4.77 |
WordPress.com is an absolute standout here. It was the fastest in 10/12 locations. Servebolt was second fastest overall and in 6/12 locations.
On the other end, GoDaddy was the slowest in 6/12 locations, and Nexcess was the slowest in 5/12 locations, and they were the slowest and second slowest, respectively.
Unsurprisingly, US and European locations tend to be much faster, while other locations spread out considerably more based on the company.
This year, in the WebPageTest, we delivered the second-fastest average response time with a load time of 1.5 seconds. We were beaten by WordPress.com, which had an average of 1.13 seconds. When comparing our results with the average, the difference really shows off. The average across all competitors was 2.23 seconds.
We are very proud of this result because that means we’re the fastest “hosting company” since WordPress.com is a managed WordPress solution and implements some hard restrictions when it comes to themes, plugins, customizability, etc.
Another interesting finding comes when you compare the averages of the top 3 with the rest. The top 3 companies (Servebolt, WordPress.com, and Pressable) delivered an average of 1.49 seconds, while the rest had an average of 2.5 seconds.
Green Hosting
It’s interesting to see an entrant who is trying to make a name in the Green Hosting space. Green Hosting requires, among other things, that you are able to reduce the number of computing resources needed to serve web pages. It’s, therefore, sad to see Green Geeks ranked at the bottom of all dynamic tests, and they also did not perform well in the cache tests and did not get a Top Tier award. We know they are doing honorable work on compensation for data center operations, but speeding up the back-end performance (increasing computing efficiency) is also a requirement for WooCommerce hosting to really become truly sustainable.
The results speak for themselves. Servebolt, just like with the general WordPress Hosting Benchmarks, performed extremely well for WooCommerce hosting as well. There’s room for improvement still in both how the tests were performed as well as things we can approve upon ourselves, but being on top of the list for WooCommerce hosting is a good spot to be in.
If you’re curious to see how our WooCommerce hosting would make your site shine under high loads and with lots of users and products in the backend, take us for a spin and try us out. We offer free 14-day trials and free migrations, so you can test our hosting to the fullest.
Just register for an account here, create a Bolt, and have us move your site in. I promise you, you will not be disappointed!